Sharing notes from my ongoing learning journey — what I build, break and understand along the way.
Building Scalable Infrastructure Monitoring with Docker, Prometheus & Grafana
Enterprise Infrastructure Monitoring: Scalable Architecture Design with Docker, Prometheus, and Grafana
In modern Information Technology (IT) operations, ensuring system uptime and performance stability requires a shift from reactive to proactive approaches. While traditional system management often detects issues only after they occur, modern DevOps and SRE (Site Reliability Engineering) practices mandate system “Observability.”
This technical report details the architectural design, installation, and analysis of a container-based, modular, and highly scalable monitoring solution from the perspective of a System Integration Specialist (Fachinformatiker Systemintegration). The project utilizes Docker as the virtualization layer, Prometheus as the metric collection engine, Node Exporter as the system agent, and Grafana as the data visualization layer. The report covers the theoretical infrastructure, integration processes, and performance analysis under load.
1. Theoretical Framework and Technology Analysis
Before proceeding with the implementation steps, analyzing why this specific Tech Stack is the industry standard and how it operates in the background is critical for understanding the logic of system integration.
1.1. Containerization and Docker Architecture
In traditional server management, a separate physical server or Hardware Virtualization (VM) was used for each application. Virtual Machines (VMs) divide the resources of the underlying hardware (Hypervisor), running a full Guest OS for each instance. This leads to significant resource waste (CPU overhead and RAM consumption).
Docker is a platform providing OS-level virtualization. Unlike VMs, Docker containers share the host machine’s operating system kernel (Linux Kernel).
- Namespaces: Docker uses the Linux Kernel’s “Namespace” feature to isolate processes. Thus, a process inside a container cannot see other containers or the host machine.
- cgroups (Control Groups): Ensures resource management. This mechanism limits how much CPU or RAM a container can consume.
- Union File Systems (UnionFS): Docker images have a layered file structure. This saves disk space and increases image portability.
The primary reason for choosing Docker in this project is the principle of “Environment Consistency.” It guarantees that the Infrastructure as Code (IaC) prepared here will run exactly the same way on a developer’s machine, a test environment, and a production server.
1.2. Prometheus: Time-Series Database and Monitoring
Developed by SoundCloud engineers and later joining the Cloud Native Computing Foundation (CNCF), Prometheus is the de facto standard for modern monitoring systems.
Why Not a Traditional Database (SQL)? Monitoring data is “Time-Series” in nature. Each data point has a timestamp and a value (e.g., 14:00:01 -> CPU 35%, 14:00:02 -> CPU 36%). Traditional SQL databases struggle with performance in such High Throughput Write scenarios. Prometheus uses its own TSDB (Time Series Database) engine, capable of processing millions of data points per second.
Pull-Based Model: Older generation tools like Nagios or Zabbix typically support a “Push” model, where agents send data to the server. This can create bottlenecks at the central server. Prometheus uses a “Pull” model. Based on the defined configuration, it goes to the targets and “scrapes” the metrics itself. This prevents system crashes and puts load control in Prometheus’s hands.
1.3. Grafana: Data Visualization and Analytics
Collecting data is only half the battle; the collected data must be made intelligible to humans. Grafana is a platform-agnostic analytics and visualization tool.
Grafana’s greatest strength is being “Data Source Agnostic.” It can display CPU data from Prometheus, sales figures from a MySQL database, and logs from Elasticsearch side-by-side on the same panel. In this project, Grafana is positioned as the interface layer that communicates with the Prometheus API to convert raw metrics (e.g., node_cpu_seconds_total) into meaningful graphs.
2. Architectural Design and Infrastructure as Code (IaC)
In this study, instead of manual system installation, the Infrastructure as Code (IaC) methodology was adopted, where the entire infrastructure is defined by code. This approach ensures the system is versionable (via Git), reproducible, and documented.
2.1. Orchestration Tool: Docker Compose
Starting a single container with docker run is easy, but managing three dependent services (Node Exporter -> Prometheus -> Grafana) is complex. Docker Compose is a tool used to define and share multi-container applications.
The project directory structure is organized as follows:
monitor-project/
├── docker-compose.yml   (Master Plan)
└── prometheus/
    └── prometheus.yml   (Database Settings)
2.2. Prometheus Configuration (prometheus.yml)
This file, the brain of Prometheus, determines the monitoring strategy.
global:
  scrape_interval: 15s  # Data collection frequency

scrape_configs:
  - job_name: 'node_exporter_metrics'
    static_configs:
      - targets: ['node-exporter:9100']
Technical Analysis:
- Scrape Interval (15s): Why not 1 second? In the real world, pulling data every second unnecessarily bloats both network traffic and disk storage. The industry standard is usually 15 or 30 seconds. This is a sufficient resolution to catch instantaneous CPU spikes.
- Service Discovery: In the
targetssection, we usednode-exporterinstead of an IP address (e.g.,192.168.1.5). Docker runs an internal DNS Server. Containers recognize each other by service names. This way, even if a container restarts and its IP address changes, Prometheus continues to find it by name. This is the cornerstone of Microservices Architecture.
2.3. Service Definitions (docker-compose.yml)
Below is the detailed analysis of the YAML file forming the system’s backbone:
version: '3.8'

services:
  # LAYER 1: Data Source (Agent)
  node-exporter:
    image: prom/node-exporter:latest
    container_name: node-exporter
    restart: unless-stopped
    volumes:
      - /proc:/host/proc:ro
      - /sys:/host/sys:ro
      - /:/rootfs:ro
    command:
      - '--path.procfs=/host/proc'
      - '--path.rootfs=/rootfs'
      - '--path.sysfs=/host/sys'
      - '--collector.filesystem.mount-points-exclude=^/(sys|proc|dev|host|etc)($$|/)'

  # LAYER 2: Data Storage
  prometheus:
    image: prom/prometheus:latest
    container_name: prometheus
    restart: unless-stopped
    ports:
      - "9090:9090"
    volumes:
      - ./prometheus/prometheus.yml:/etc/prometheus/prometheus.yml
    command:
      - '--config.file=/etc/prometheus/prometheus.yml'

  # LAYER 3: Visualization
  grafana:
    image: grafana/grafana:latest
    container_name: grafana
    restart: unless-stopped
    ports:
      - "3000:3000"
    depends_on:
      - prometheus
Critical Configuration Details:
- Volume Mapping and
roFlag: Node Exporter is an isolated container. However, its task is to read the Host machine’s CPU and RAM information. In Linux, this information is kept in the/procand/sysvirtual file systems.- The line
- /proc:/host/proc:romounts the host’s/procdirectory inside the container as/host/proc. - The
:ro(Read-Only) flag is a Security Measure. It allows the container to read these critical system files but prevents it from modifying (writing to) them.
- The line
- Restart Policy (
unless-stopped): This setting ensures that containers are automatically restarted if the server reboots or the Docker service crashes. It is a mandatory setting for Production environments. - Depends On: The Grafana service depends on Prometheus. Docker Compose uses this command to organize the startup order (Database first, then Interface).
3. Deployment and Integration Process
After the design phase, the process of deploying the system to live operation was executed.
3.1. Pulling Images and Startup
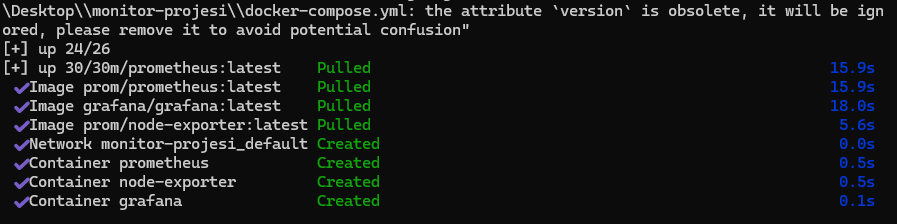
The docker compose up -d command was executed in the project directory via the terminal (CLI). The -d (detached) parameter allows containers to run in the background mode, so the terminal is not locked.
The image below shows the Docker engine downloading the necessary image layers from the Registry and creating the containers.
3.2. Service Health Check
To verify that the system started successfully, the docker compose ps command was used. For a system integrator, “no error” does not mean “working”; the status must be confirmed.
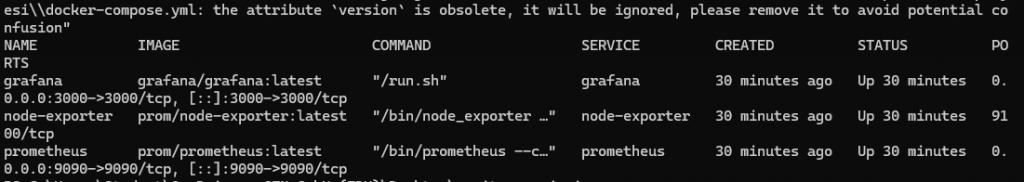
As confirmed by the visual:
- Grafana (3000/tcp): External access to the web interface is open.
- Prometheus (9090/tcp): Metric query port is open.
- Node-Exporter (9100/tcp): Agent is active.
3.3. Grafana and Prometheus Integration
The systems are running but not yet talking to each other. By logging into the Grafana interface (localhost:3000), Prometheus was defined as a “Data Source.”
During integration, http://prometheus:9090 was used as the URL instead of http://localhost:9090. This demonstrates the correct usage of Docker’s internal networking structure. The green confirmation message received upon clicking “Save & Test” proved that the API connection was successful.
3.4. Dashboard Provisioning
To visualize the raw data, the community-developed and industry-standard “Node Exporter Full” (ID: 1860) template was imported into the system. This template automatically parses hundreds of raw metrics like node_load1 and node_memory_MemTotal into visual panels.
4. System Analysis, Stress Test, and Interpretation of Results
It is necessary not only for the system to run but also to report correct data under load. For this purpose, a Stress Test was applied to measure the reaction of the metrics.
Test scenario:
- CPU: Mathematical loops were run on all cores via a PowerShell script.
- RAM: High memory-consuming processes were initiated.
- Network: Network traffic was generated using 4K video streams and Speedtest.
4.1. Interpretation of Metrics
The dashboard image below shows the instantaneous status of the system under load. Reading this screen is vital for a system administrator.
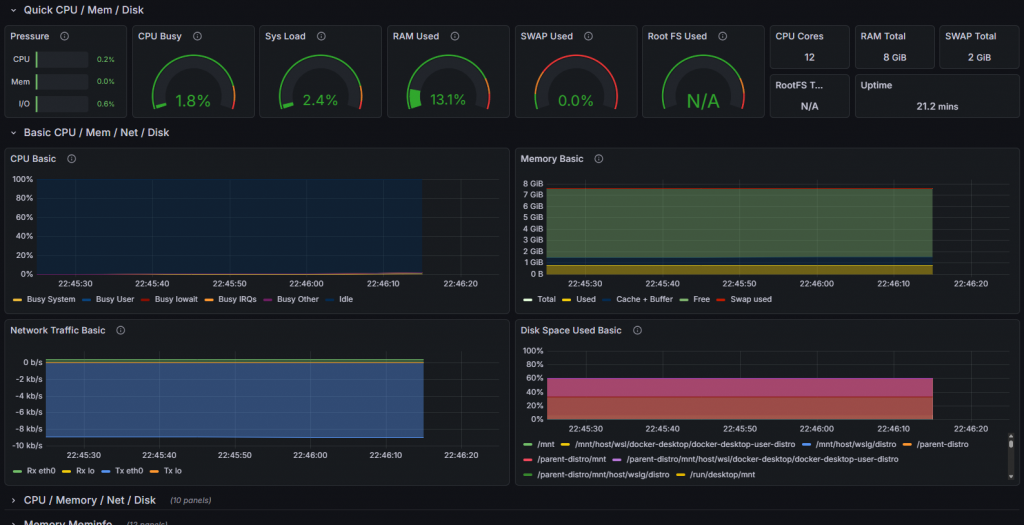
- CPU Busy (1.8% – Spikes): The green gauge in the screenshot shows the current processor intensity. The instantaneous rise (Spike) of this value during the test shows that Prometheus processes data with Low Latency. If the graph freezes when the system freezes, the monitoring system has failed; however, the fluctuation of graphs here proves the system is healthy.
- Sys Load: Represents the number of threads waiting in the processor queue. If this value exceeds the number of cores, it is the clearest sign that the system is entering a Bottleneck.
- RAM Used (13.1%): Memory usage rate. If this graph constantly goes up over time (instead of a sawtooth pattern), it is a harbinger of a critical error called “Memory Leak” in the software world. Our system RAM usage appears stable.
- Network Traffic Basic: The blue graph at the bottom shows data packets (RX/TX) passing through the network card. Sudden and unexplained traffic surges may raise suspicion of a cyber attack (DDoS) or data theft.
5. Enterprise Scalability and Future Vision
Although this project was carried out in a local environment (Localhost), the architecture used is identical to that used in Peta-Byte scale data centers.
The improvements I would make when moving this structure to an Enterprise Environment are as follows:
- Service Discovery: In an environment with hundreds of servers, it is impossible to manually write servers into the
prometheus.ymlfile one by one. I would integrate this structure with Kubernetes or Consul to ensure that newly added servers are automatically included in monitoring (Auto-Discovery). - Alertmanager Integration: Currently, we need to look at the screen to see issues. By adding the Alertmanager component of Prometheus, automation rules such as “Send a message on Slack if CPU usage exceeds 90%” or “Send an email to the IT team if Disk usage reaches 95%” would be defined.
- Persistent Storage: Currently, data is kept inside the container. If the container is deleted, historical data is lost. In a corporate structure, Prometheus data would be connected to an external storage unit (Persistent Volume) to prevent data loss.
- Security: Grafana and Prometheus interfaces currently run over HTTP. In a corporate structure, an Nginx Reverse Proxy would be placed in front of them to provide SSL/TLS encryption (HTTPS) and central authentication via LDAP/Active Directory integration.
6. Conclusion
Within the scope of this work, the concept of Observability, the cornerstone of modern software and system operations (DevOps), has been put into practice.
We did not stop at simply installing ready-made tools; a unified solution was produced by combining the disciplines of Linux Filesystem (/proc, /sys), Network Communication (Port Mapping, DNS), Virtualization Technology (Docker), and Data Analytics (Time-Series Data). The resulting system is a professional tool that listens to the “Heartbeat” of an IT infrastructure and allows for the detection of problems before they occur.