Sharing notes from my ongoing learning journey — what I build, break and understand along the way.
IIoT Project Part 3: Remote Control & Automation
Industrial IoT Part 3: Event-Driven Architecture, Remote Shutdown via Telegram, and Automated Reporting
In Part 2, we established the core of our data pipeline: secure ingestion, persistence with InfluxDB, and real-time visualization with Grafana. The system could “see” and “record,” but it lacked the ability to “speak” and “act.”
In this third and final phase of our secure IIoT pipeline series, we transform a passive monitoring system into an active, Event-Driven ecosystem. We address one of the biggest challenges in industrial automation: Closing the loop between detection and intervention.
In this article, we detail how we implemented a bi-directional control mechanism via Telegram, developed a logic for “Triple-Peak” anomaly detection, and automated the generation of professional forensic reports (PDF) containing high-resolution sensor trends using Python libraries like matplotlib and fpdf.
Before moving on to what we did in Part 3, I’ve included a video of the result here. Afterward, you can read about the process in detail.
1. The Need for Actionable Intelligence in Industry 4.0
In traditional SCADA systems, an alarm is often just a flashing light on a screen in a control room. If the operator is not looking at that specific screen, the event is missed until it becomes a catastrophe.
Industry 4.0 demands more. It requires systems that:
- Push Notifications: Alert the right personnel instantly, regardless of their location.
- Allow Remote Intervention: Enable authorized shutdown protocols securely over VPN tunnels.
- Automate Documentation: Generate incident reports instantly for post-mortem analysis.
For this project, we chose Telegram Bots as our interface due to their robust API, push notification reliability, and support for file transfers (PDFs).
2. Architecture: The “Manager & Reporter” Dual-Bot Strategy
To maintain the principle of Separation of Concerns, we architected a dual-bot system rather than a monolithic script. This ensures that the heavy lifting of generating PDF graphics does not block the real-time sensor loop.
2.1. The Operator Bot (Control Interface)
This bot acts as the interface for the human operator. It is embedded directly into the main sensor loop (industrial_sensors.py).
- Role: Listens for critical thresholds and presents “Interactive Buttons” to the user.
- Protocol: Uses
telebot(pyTelegramBotAPI) running in a separate thread to ensure non-blocking I/O.
2.2. The Maintenance Bot (Reporting Service)
This is a specialized service (maintenance_service.py) that remains dormant until triggered by a specific event.
- Role: Receives raw data arrays, renders trend graphs, compiles a PDF, and sends it to the engineer.
- Advantage: By offloading the rendering of
matplotlibgraphs to this service, we prevent the main sensor node from experiencing latency spikes (jitter) during data acquisition.
3. Advanced Anomaly Logic: The “Triple-Peak” Condition
In Part 2, we simulated random noise. In Part 3, we introduced a sophisticated failure scenario known as the “Triple-Peak Anomaly.” Real industrial failures rarely happen in isolation; a rise in temperature usually correlates with pressure instability and vibration spikes.
We programmed the industrial_sensors.py script to detect a simultaneous breach of three distinct thresholds:
- Temperature (T): > 100.0 (Thermal Runaway)
- Pressure (P): > 20.2 bar (Hydraulic Instability)
- Vibration (V): > 1.31 mm/s (Mechanical Looseness)
Code Logic Snippet
The system uses a “Critical Lock” mechanism to prevent alarm fatigue. Once the threshold is breached, the system enters a locked state and waits for human intervention via the Telegram Callback Query.
# The Triple-Peak Condition
if current_t > 100.0 and current_p > 20.2 and current_v > 1.31 and not critical_lock:
    # Trigger Telegram Alert with Inline Keyboard
    bot.send_message(CHAT_ID, "🚨 CRITICAL ALERT: TRIPLE PEAK REACHED!", reply_markup=shutdown_btn)
    critical_lock = True
4. Closing the Loop: Remote Shutdown & Recovery
The most critical feature of this phase is Remote Control. When the anomaly occurs, the Telegram bot sends a message with a specialized InlineKeyboardButton labeled “🛑 SHUTDOWN SYSTEM”.
4.1. The Callback Query Handler
When the authorized admin presses this button:
- Authentication: The bot verifies the
callback_data. - State Change: The system variable
is_recoveringis set toTrue. - Cool-down Period: A 300-second (5-minute) safety lock (
cooldown_until) is activated, preventing the system from re-entering a critical state immediately. This simulates the physical time needed for a machine to cool down.
This demonstrates a Human-in-the-Loop” (HITL) architecture, where AI/Algorithms detect the issue, but a human makes the final executive decision to stop production.
5. Automated Reporting (The PDF Engine)
Perhaps the most technically impressive feat of this project is the dynamic generation of the Incident Analysis Report. A text message saying “System Stopped” is not enough for an engineering team; they need data.
We utilized the matplotlib library with the Agg backend (non-interactive) to generate high-resolution trend graphs on a headless Linux server.
5.1. Data Buffering Strategy
To create meaningful graphs, the system maintains a “rolling buffer” (a list) of the last 120 data points for Temperature, Pressure, and Vibration.
- Challenge: Keeping history without consuming infinite memory.
- Solution: Using Python’s list operations (
pop(0)) to maintain a strict “First-In-First-Out” (FIFO) queue representing the last 2 minutes of operations.
5.2. The Report Structure
The maintenance_service.py generates a single-page, high-density information sheet containing:
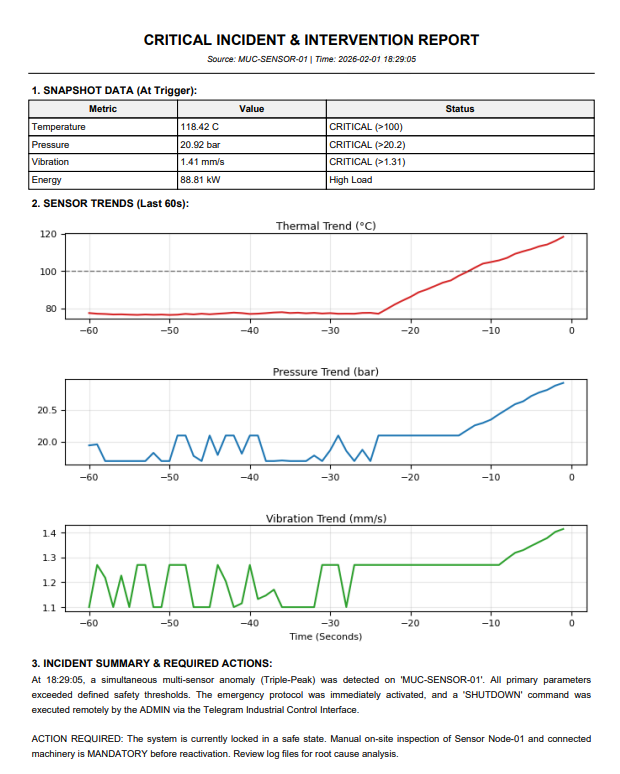
- Header: Timestamp, Source Node ID (MUC-SENSOR-01), and Protocol Type.
- Snapshot Table: Exact values of T, P, V, and Energy Load at the moment of the trigger.
- Multi-Axis Trend Graph: A 3-panel plot showing the exact rise of all parameters 60 seconds prior to the shutdown. This proves that the failure was gradual, not instantaneous.
- Action Log: A generated text block summarizing the event and mandating on-site inspection.
6. Technical Deep Dive: Challenges & Solutions
6.1. The “Main Thread” Issue in Matplotlib
Problem: Attempting to plot graphs inside the main sensor loop caused the entire data transmission to freeze for 2-3 seconds.
Solution: We moved the reporting logic to a separate function/module (maintenance_service). Furthermore, we explicitly set matplotlib.use('Agg') to ensure the library didn’t try to open a GUI window on a server that has no screen, which would have caused a crash.
6.2. Function Signature Mismatches
Problem: As we expanded the report to include Pressure and Vibration history, the communication between the sensor script and the reporting service broke (TypeError).
Solution: We refactored the data passing mechanism to send full list objects (t_history, p_history, v_history) instead of single integers. This allowed the reporting service to reconstruct the timeline perfectly.
6.3. Formatting for Mobile Executives
Problem: Initial PDF reports had large gaps or split across two pages, making them hard to read on a phone screen via Telegram.
Solution: We optimized the figsize to (8, 5.5) and adjusted the subplot spacing (hspace) to fit the Table, Graphs, and Summary Text perfectly onto a single A4 page.
7. The Final Workflow: A Walkthrough
To summarize the complete lifecycle of an event in our Part 3 architecture:
- Normal Operation: Sensor Node sends data to InfluxDB/Grafana via MQTT over WireGuard. (Status: Green)
- Anomaly Injection: The script triggers the “Triple-Peak” simulation. Temp rises to 102°C, Pressure to 21 bar.
- Detection: The logic catches the threshold breach. The
critical_lockis engaged. - Alerting: The Operator Bot pushes a “CRITICAL ALERT” message to the private Telegram channel with a “SHUTDOWN” button.
- Intervention: The Admin clicks “SHUTDOWN”.
- Recovery & Reporting:
- The system enters “Cool-down Mode” (variables decay exponentially).
- The Maintenance Bot generates the PDF report with the last 60 seconds of data.
- The PDF is uploaded to the chat with the caption: “Critical Incident Report Generated. Immediate action required.”
8. Conclusion: From “IoT” to “AIoT”
By completing Part 3, we have built a system that rivals commercial SCADA solutions in terms of functionality. We have demonstrated that with open-source tools (Python, Linux, Telegram API, Matplotlib), one can build a secure, responsive, and documented industrial control system.
This project proves that the future of IIoT is not just about collecting data, but about integrating that data into human workflows.