Sharing notes from my ongoing learning journey — what I build, break and understand along the way.
1 Million Rows in 8ms: SAP HANA on Docker Performance Test
High-Velocity Analytics: Benchmarking SAP HANA with 1 Million Records on Docker
In today’s business world, data is the new oil; however, raw oil is meaningless unless refined. The speed of processing data is the key to competitive advantage. Traditional Relational Database Management Systems (RDBMS) store data on physical disks and fetch it into RAM every time a query is executed. This architecture inevitably creates an I/O bottleneck when dealing with millions of rows.
This is where SAP HANA enters the stage. HANA is a hybrid analytical engine that keeps data directly in RAM (In-Memory) and stores it in a Columnar format. In this article, we will explore how we tamed the enterprise-grade beast, SAP HANA Express Edition, on Docker and visualized a massive dataset of 1,000,000 records in mere milliseconds.
1. Architectural Infrastructure: Why Docker?
For flexibility and isolation, we chose the Docker container architecture. Instead of installing heavy-duty software like SAP HANA directly onto the host OS, containerizing it provided several key advantages:
- Rapid Deployment: We stood up the SAP HANA Express Edition image in seconds without dealing with complex installation steps.
- Resource Management: Thanks to Docker, we precisely defined the memory and CPU limits HANA could consume.
- Portability: We eliminated the “it works on my machine” problem, making the system deployable and stable in any environment.
2. A Look at the Heart of the System: Services and Resource Management
When a SAP HANA instance runs, critical services such as nameserver, indexserver, and compileserver act in synchronized harmony. To verify the efficiency and health of the system on Docker, we first focus on the resource consumption data.
Technical Evidence: Docker Stats Analysis As seen in the table below, live statistics from Docker document the system’s stability:
- Memory (RAM) Management: Out of a 15.25 GB limit, approximately 5.6 GB is actively being used. This value proves how disciplined SAP HANA manages memory even at an entry-level and how it optimizes resources while keeping data “In-Memory.”
- CPU Load: Operating with a low load of 13.83% while idle, the system demonstrates that it has a massive capacity reserve for complex analytical queries.

3. Data Volume and Scalability: The 1 Million Row Proof
To prove the power of our analysis, 1,000,000 sales records with a logical structure were generated. The analytical competence of a database is measured by its ability to maintain response times as record counts grow.
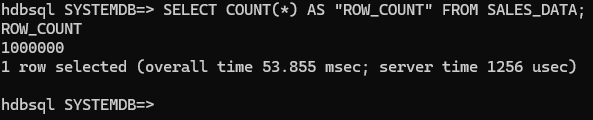
Technical Evidence: Row Count and Query Speed The result of SELECT COUNT(*) FROM SALES_DATA; from the SQL terminal formalizes the scale of this test:
- Scale: There are exactly 1,000,000 records in the database.
- Speed Performance: The most striking detail here is not just the size of the number, but that the query was completed in server time: 1256 usec (microseconds). SAP HANA completed the check and count of 1 million rows in less than one-thousandth of a second, showcasing the undeniable difference of “In-Memory” architecture.
4. Analytical Engine Performance: Complex Calculations
We positioned SAP HANA not just as a data store, but as an “Analytical Engine” where heavy mathematical operations take place. We pushed many operations, which would normally be expected at the application layer, directly down to the database level.
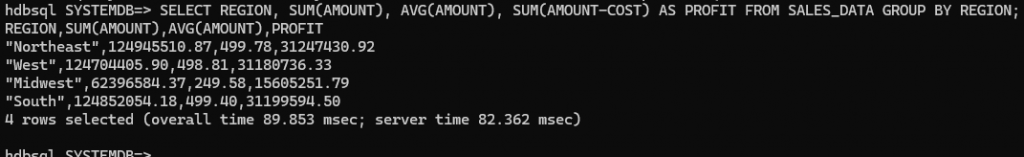
Technical Evidence: Multi-Dimensional Grouping and Aggregation The complex query below includes the system simultaneously grouping four regions, calculating total revenues, finding the average sale, and calculating the profit (Amount - Cost) for every single row:
- Processing Speed: This complex batch operation took a total of only 82.362 ms (milliseconds).
- Impact of Columnar Storage: While this process could take seconds or even minutes in traditional disk-based systems, HANA scans only the relevant columns and returns the result almost instantaneously.
5. Technical Depth: Why Is It So Fast?
There are three main technological pillars behind why this system operates so rapidly:
A. Columnar Storage
Traditional databases read the entire row. If we only want the sum of “Amount,” HANA only reads the memory blocks belonging to that specific column. Millions of other unnecessary data points (customer names, addresses, etc.) are excluded from the process.
B. Data Compression
The columnar structure offers very high compression rates because the data types within a column are similar. 1 million rows shrink enough to fit into the processor’s L3 Cache, occupying much less space in memory.
C. Parallel Processing
HANA breaks queries into parts and utilizes all processor cores simultaneously. When a query arrives, the CPU attacks this data with its full power and finishes it in milliseconds instead of seconds.
6. Web Dashboard: Turning Data into Value
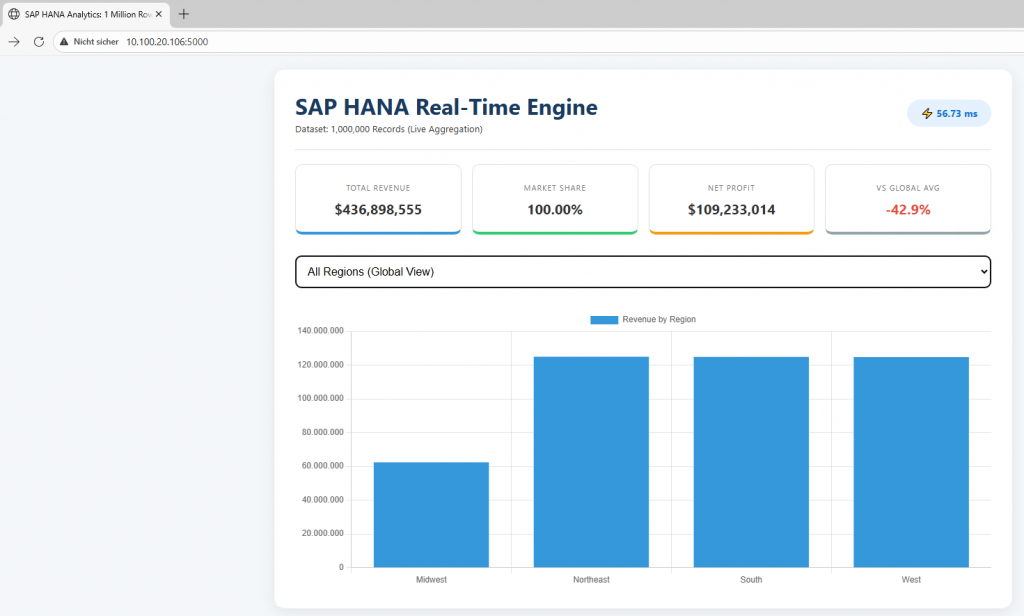
After building the bridge between the Python (Flask) backend and HANA, we designed a sleek interface to let the end-user feel this speed.
User Experience and Performance: As seen in our demo video:
- Dropdown Menu: When a user selects a region, the query triggered in the background hits HANA instantly.
- Speed Badge: The Processing Speed: 8.46 ms indicator on the screen is the physical manifestation of the “real-time” concept in the software world.
- Dynamic KPI Cards: Critical metrics like Total Revenue, Net Profit, and Profit Margin are updated instantly by rescanning 1 million rows with every selection.
7. Conclusion: From Data to Value in Milliseconds
Through this project, we have proven that when the right architecture (Docker) meets the right engine (SAP HANA), “Big Data” is no longer a burden but a real-time playground. Being able to process 1,000,000 rows in 8 milliseconds is not just a technical achievement; it is a business revolution that reduces decision-making mechanisms from minutes to seconds.
This setup serves as a perfect foundation for more advanced projects, such as integrating Predictive Analytics libraries for future sales forecasting.