Sharing notes from my ongoing learning journey — what I build, break and understand along the way.
SAP HANA Administration Notes – Part 2 – Monitoring
SAP HANA Monitoring: From Alerts to Real System Management
Disclaimer
This content is based on my personal learning experience using SAP Learning Hub.
All screenshots are taken from a training environment and do not include any sensitive or customer-specific data.
In accordance with SAP Learning Hub usage policies, I do not share full system views. Screenshots are only included to provide context about the menus and features being used.
Picking Up Where I Left Off
In my previous post, I shared my first hands-on experience with installing SAP HANA and getting familiar with its core components.
This time, I continued from where I left off—focusing not on installation, but on what happens after the system is up and running.
What does it really mean for a system to be “running”?
When the System Is “Up” — Is It Really Healthy?
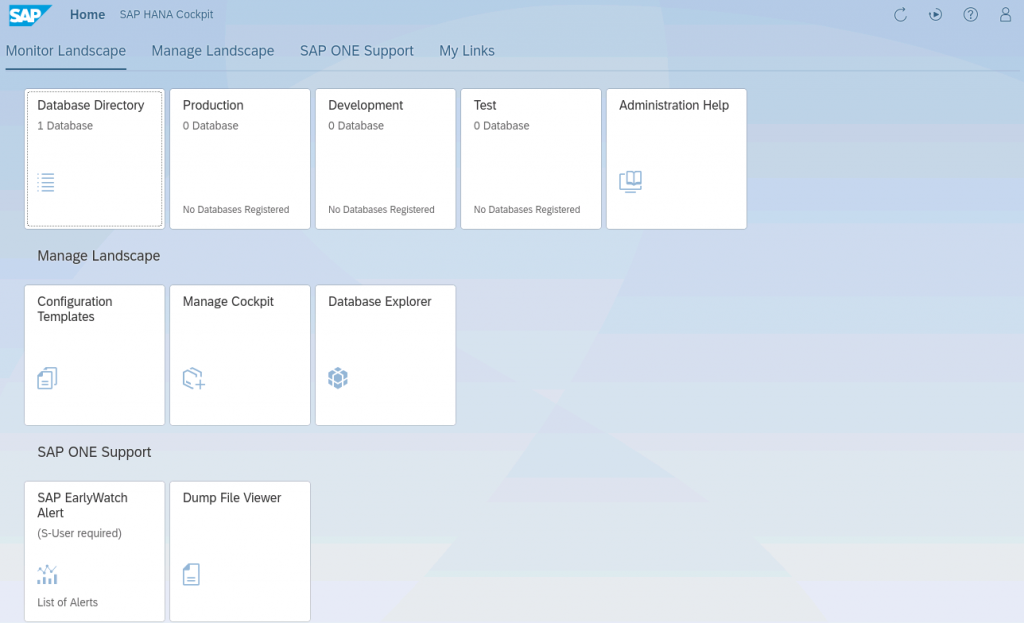
After completing the installation, I accessed SAP HANA Cockpit to observe the system from an operational perspective.
At first glance, everything looked fine:
- Services were running
- The system was accessible
- No obvious errors were visible
However, once I navigated into the monitoring and alert sections, a different picture started to emerge.
Alerts: The System Is Communicating with You
Inside the Cockpit, I encountered a couple of high-priority alerts:
- No data backup available
- OS-level configuration warning (Transparent Huge Pages)
At that moment, I realized something important:
A system can be running without being in a healthy state.
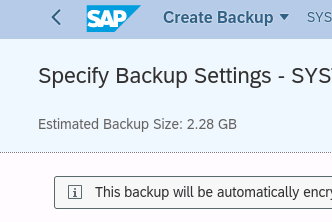
Taking Action: My First Real Admin Task
One of the alerts clearly stated:
“Perform a data backup as soon as possible.”
This was not just a warning—it was an action item.
Instead of just observing, I initiated a data backup directly from the Cockpit.
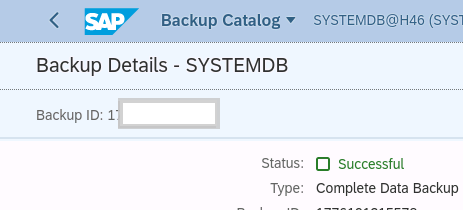
Once the backup completed successfully, it felt like a meaningful step forward.
Because at that point, I was no longer just exploring the system—I was actively managing it.
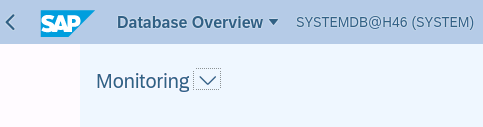
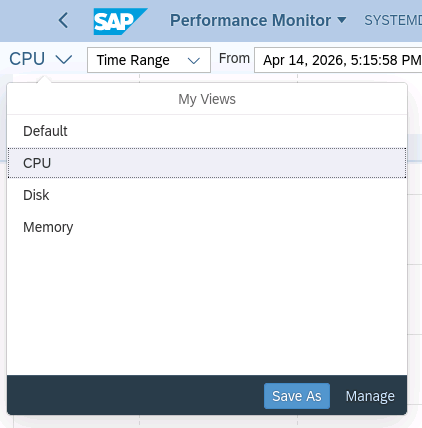
Monitoring System Resources
Next, I explored the Performance Monitor.
This provided a real-time view of system behavior:
- Memory usage
- CPU activity
- Disk consumption
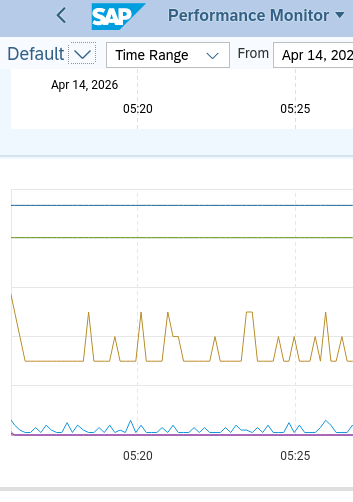
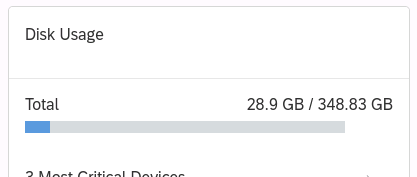
One interesting observation:
The system was using roughly half of its available memory, but the graph remained stable with no unusual spikes.
This led me to an important insight:
In SAP HANA, high resource usage does not necessarily indicate a problem.
Stability is more important than raw utilization numbers.
Not Every Issue Is a Database Issue
Another alert pointed to an OS-level configuration issue related to Transparent Huge Pages.
Although I did not modify the OS settings directly, this highlighted an important concept:
Not all SAP HANA issues originate from the database itself.
Some are rooted in the underlying infrastructure.
This was my first real exposure to the interaction between:
- Database systems
- Operating system configuration
- Overall system architecture
What This Step Taught Me
Continuing this journey made several things clear:
- Installation is only the beginning
- Monitoring reveals the true state of the system
- Alerts are not noise—they are guidance
- Small actions (like taking a backup) can be critical
And most importantly:
Working with SAP is less about following steps
and more about understanding system behavior.
What’s Next?
This step helped me move from installation into observation and system management.
In the next phase, I plan to focus on:
- user and authorization management
- deeper performance analysis
- understanding system behavior under different conditions
Final Thought
This experience reinforced something I am beginning to understand more clearly:
SAP may look complex from the outside,
but once you interact with the system, patterns start to emerge.
And the only way to truly understand those patterns is:
by working directly with the system.