Sharing notes from my ongoing learning journey — what I build, break and understand along the way.
Speed, Control, and Efficiency in Server Management: Why I Built My Own Terminal-Based Tool
How a Lightweight Terminal-Based Server Manager Helped Me Simplify Daily System Administration
Anyone who manages servers knows this very well: setting up a server is only the beginning. The real process starts after that. File edits, service checks, log monitoring, permission management, package updates, network checks, Docker operations, disk cleanup, user activity, firewall management — a large part of your time goes into small but critical operations. Most of these tasks are not difficult on their own. But when repeated dozens of times throughout the day, they turn into a serious loss of time.
That is exactly the point I started from.
Because I work with servers so much, constantly running the same commands over and over, navigating to the correct directory, checking logs, restarting services, adjusting permissions, and viewing system status through separate commands eventually started to feel inefficient. Even though everything can be done through terminal commands, in practical terms it is much faster to move forward with a “single screen,” a “single flow,” and a “one-click logic.”
That is why I developed a tool born directly from my own needs: a lightweight, fast, terminal-based Server Manager focused entirely on direct system administration.
In this article, I will explain in detail why I developed such a tool, what problems it solves, what the menus and panels inside it do, how it saves time in server management, and which features I plan to add in the future.
Why Did I Need a Tool Like This?
In server management, the classic method is obvious: connect via SSH, go to the necessary directory, use ls, cd, cat, tail, grep, systemctl, journalctl, chmod, chown, ip, ss, df, free, docker, ufw, and dozens of other commands in sequence. If you do these things only occasionally, this method is enough. But if most of your day is spent on server maintenance, inspection, debugging, and organization, that command traffic becomes exhausting.
My goal was not to eliminate the command line. On the contrary, it was to preserve the power of the terminal while making it more fluid.
My target was this:
- Manage the tasks I perform frequently on the server from a single center
- Reduce unnecessary command repetition
- Speed up file and system management
- View live system data on the same screen
- Reduce the risk of mistakes in administrative operations
- Provide a more controlled structure for tasks that require root privileges
- Bring log, service, network, disk, and permission operations out of a scattered workflow
In short, this project became an effort to take the mindset of “I can do everything with commands” one step further by asking: “Why shouldn’t I do these things faster and in a more organized way?”
The Command Line Is Powerful, But Speed Is Not Always in the Command Itself
In the world of Linux and server administration, many people think speed comes only from keyboard mastery and command knowledge. That is partially true. But operational speed is something else.
For example, you want to check a service. Then you want to inspect its logs. Then restart it. Then glance at disk usage. Then examine growing files under /var/log. Then go to a config file and edit it. Then change its permissions. Each of these requires a separate command, a separate output, and a separate workflow.
This becomes especially slow during high-pressure moments.
In the tool I developed, the goal was to perform the same tasks with less mental context switching. So the tool does not replace commands; it makes them more accessible, faster, and more organized.
How Does the Tool Work?
This project was developed in Python, and a curses-based structure was used for the terminal interface. In other words, it is a lightweight and fast tool that runs directly inside the terminal without requiring a graphical interface. This makes it comfortable to use over SSH sessions on remote servers with low resource consumption.
The general structure of the tool is built around two main ideas:
- The first is file and directory management.
- The second is system management and monitoring.
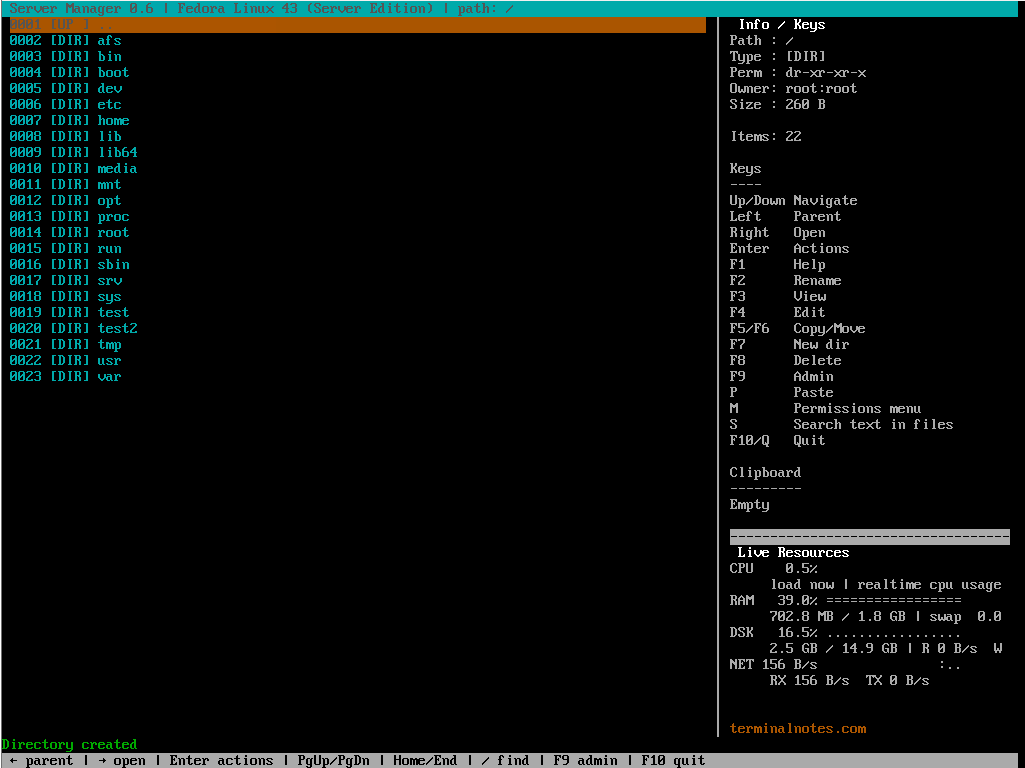
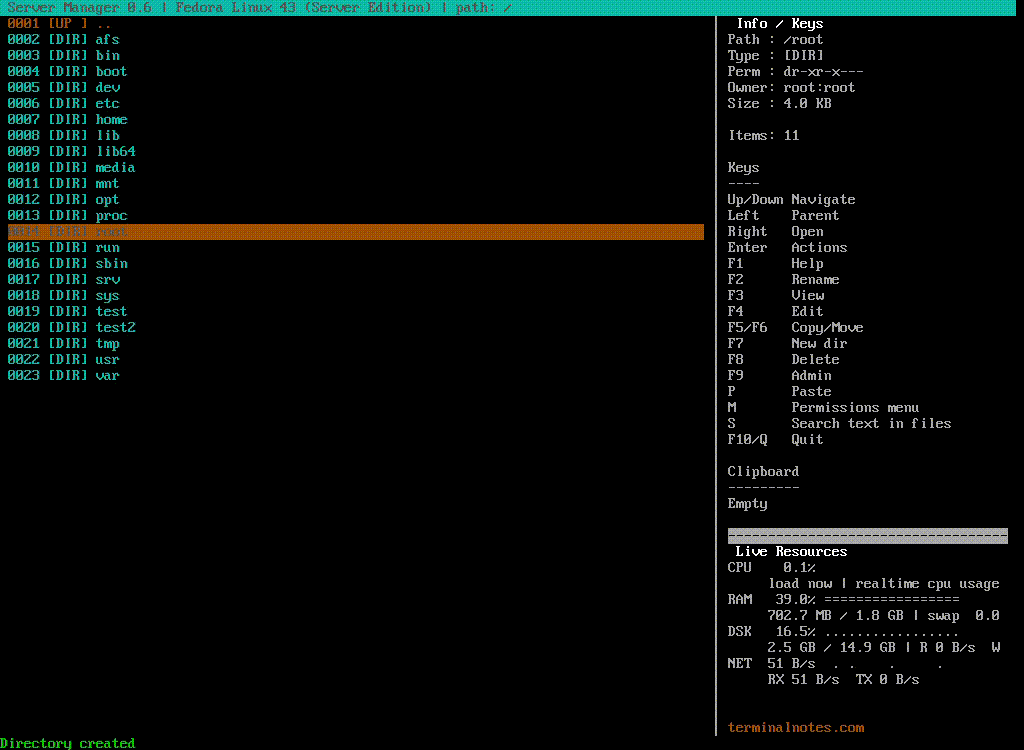
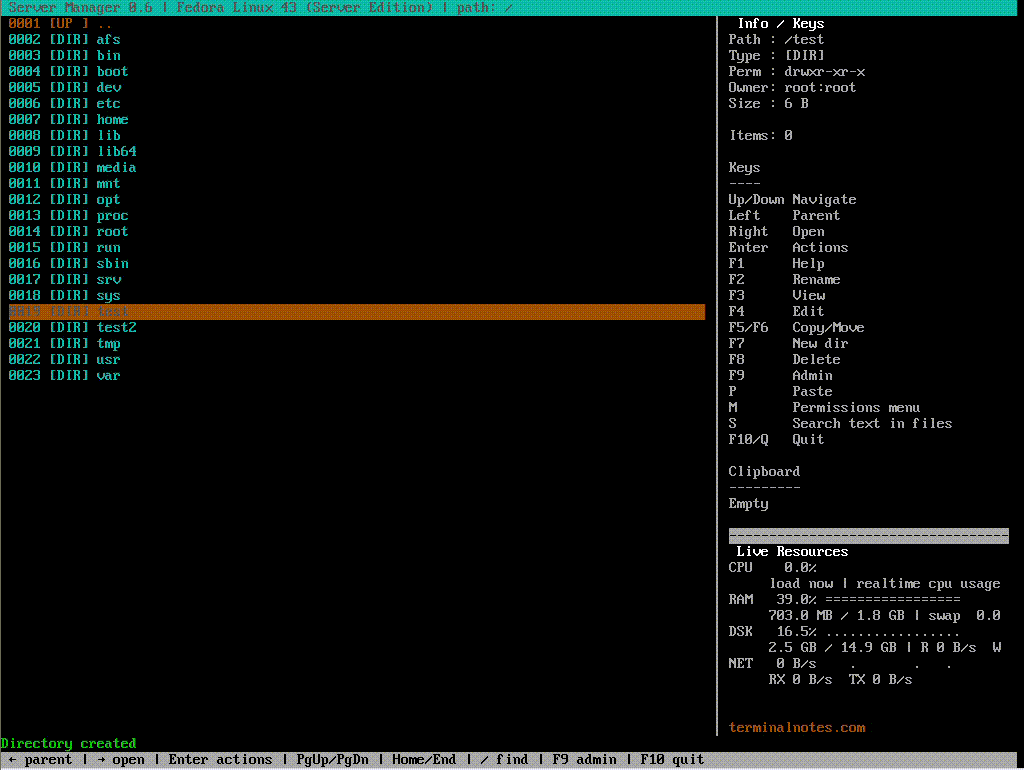
On the main screen, the left side lists folders and files in the active directory. On the right side, there are details about the selected item, shortcut keys, and a live system resources panel. This makes it possible to navigate the file system while monitoring system health at the same time.
Main Screen: Server Control with a File Manager Logic
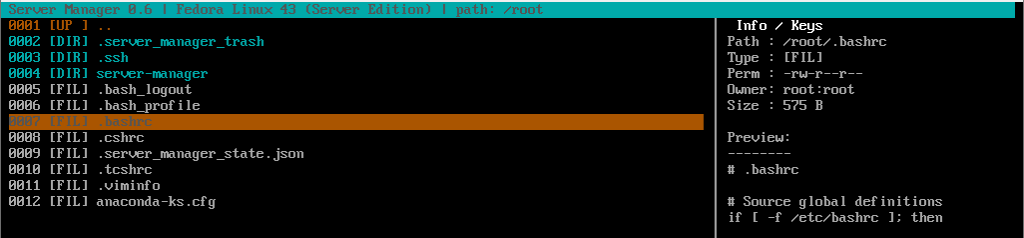
One of the most useful aspects of this project is that it offers a kind of file manager experience inside the terminal. You can move quickly through folders and files on the server. You can view, edit, rename, or place the selected item into a copy or move queue.
The main advantage here is this: instead of constantly moving back and forth between commands like cd, ls, mv, cp, and rm, you get a more controlled and visual workflow.
The highlighted file operations are:
- Directory navigation
- Quick return to parent directory
- Create new folder
- Rename file
- View text files
- Edit file
- Copy and move queue
- Paste into target directory
- Move to trash
- Permanent delete
- Archive
- Extract archive
- Edit permissions and ownership
Especially for someone working with configuration files on servers, this structure provides serious convenience. You can see where the file is located and act on it directly.
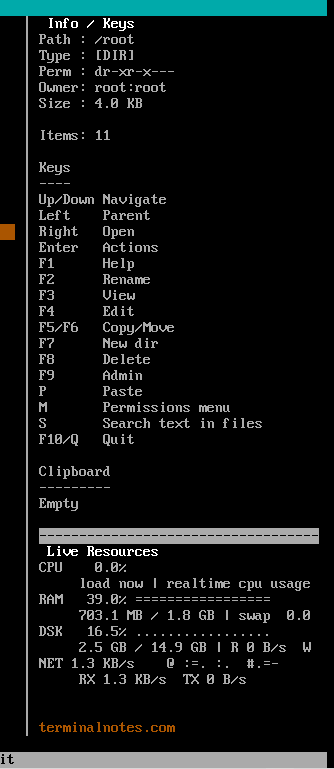
Instant Information on the Right Panel: Understand What You Selected
One of the details I especially wanted while designing this project was to provide instant information on the right side for the selected file or folder.
Here, the following information can be seen quickly:
- Path information
- Item type
- Permission details
- Owner and group information
- Size information
- If it is a folder, the number of items inside
- If it is a text file, a short preview
This may seem like a small detail, but it actually provides a major usability advantage. Because very often, before opening a file, you want to know what it is, who owns it, what permissions it has, and approximately how large it is.
Live Resource Monitoring: CPU, RAM, Disk, and Network on the Same Screen
In server management, the real-time condition of the system is often one of the most critical topics. That is why I added a live resource monitoring panel to the project.
With this panel on the main screen, the following data can be tracked in real time:
- CPU usage percentage
- RAM usage ratio
- Swap usage
- Disk usage ratio
- Disk read and write speed
- Network receive and send speed
In addition, these values are shown not only as numbers but also with small ASCII-based graphs and sparklines. This makes it much easier to notice sudden spikes or unusual activity in the system.
This feature is especially useful in situations like:
- Watching system load after restarting a service
- Noticing sudden CPU spikes
- Seeing RAM bottlenecks
- Understanding disk I/O intensity
- Detecting abnormal movement in network traffic
There is also a separate Live System Monitor screen for this. So if desired, system resources can be monitored in a wider view.
Permission Management: chmod, chown, chgrp from One Place
One of the most sensitive aspects of file management on a server is permissions. A wrong chmod or an incorrect ownership assignment can break a working system. For this reason, I wanted to make permission management more controlled as well.
Inside the tool, there is a separate Permissions menu for the selected file or folder. From here, you can perform:
chmodchownchgrp
Especially on the chmod side, ready-made preset options provide major convenience. For folders, common modes such as 755, 750, and 700 are available; for files, 644, 600, 664, and 755 can be selected directly. In addition, entering a custom octal value is also possible.
This allows the user to act quickly in common scenarios while reducing the risk of writing incorrect commands.
Content Search: Text-Based Search Inside a Directory
On the server side, searching through config, log, or project files is a very common need. Especially in large directories, finding a specific setting, an error message, a keyword, or a domain name can sometimes be difficult.
With the content search feature in this tool, text-based scanning can be performed under the active directory. The system first tries a fast grep-based search, and if necessary, falls back to a Python-based backup search mechanism. Results are listed together with the file path, line number, and matching content. If desired, the relevant file can be opened directly around that line.
This feature is very useful in scenarios such as:
- Finding a specific domain line in Nginx or Apache settings
- Searching for keys in
.envor config files - Catching error messages in log files
- Seeing all places where a string appears in a project directory
Service Management: Bringing the systemctl Workflow into a Single Menu
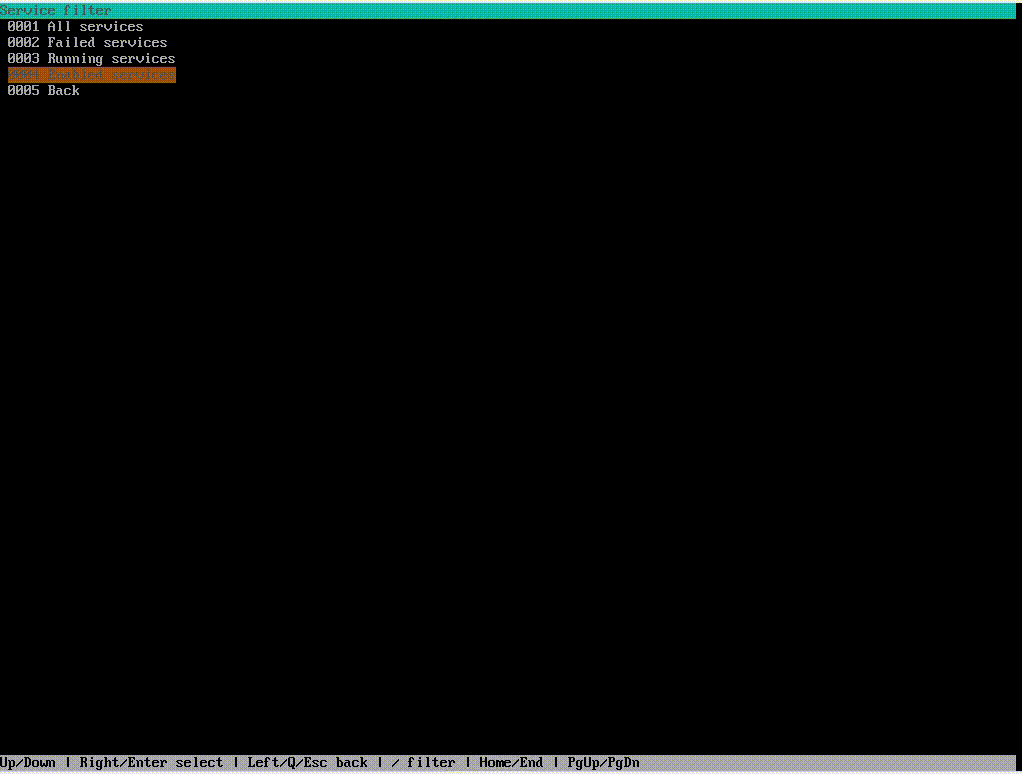
In servers, service management is at the center of daily work. That is why I added a separate Services menu to the tool.
Here, services can be listed with different filters:
- All services
- Failed services
- Running services
- Enabled services
On a selected service, the following actions can be performed:
- Show status
- Restart
- Stop
- View recent logs
This structure makes it easier both to identify problematic services more quickly and to intervene more easily. Especially collecting operations like systemctl status, journalctl -u, restart, and stop into a single workflow provides serious practical value operationally.
Log Management: Tracing Errors More Quickly
Server management is unthinkable without log tracking. That is why I handled the logging side as a separate section in the project.
Inside the tool, access is provided to the following log sources:
- Auth log
- Syslog / messages
- Kernel log (
dmesg) - Current boot journal
- Live journal monitoring
The live log monitoring section is especially important. Because some errors can only be detected by observing the live stream during an operation. For this, a tracking screen similar to journalctl -f was added. If desired, only SSH/SSHD logs or only error-level logs can also be followed live.
This feature is especially useful when:
- Monitoring SSH connection issues
- A service fails to come up
- Checking whether there is blocking on the firewall or auth side
- Wanting to see the live flow of errors
Package Management: Tracking Updates and Reboot Requirements
Server updates are often postponed but should never be neglected. For this reason, the tool detects Debian-based and RHEL-based systems and determines the appropriate package manager workflow accordingly.
The package menu contains the following operations:
- Refresh metadata
- List upgradable packages
- Upgrade all packages
- Check whether a reboot is required
Depending on the operating system, the system uses tools like apt, dnf, or yum appropriately. This provides a more consistent experience across different Linux distributions.
Being able to see whether a reboot is required, and which packages caused it, has been particularly useful for maintenance planning.
Network Menu: Quickly View the Server’s Network State
A separate menu was added for the network side, focused on basic but highly useful daily information. From here, you can view:
- IP addresses
- Routing information
- DNS configuration
- Listening ports
from a single point.
These are often the first answers to questions like: “The server is running, but why is it inaccessible?”, “Which port is open?”, “Is DNS resolution working correctly?”, or “Is there a routing issue?”
Docker Support: Managing Containers from the Same Tool
Since Docker has become almost standard in server management, the tool also includes a Docker menu. If Docker is installed on the system:
- All containers can be listed
- Only running containers can be shown
- Container logs can be examined
- Logs can be followed live
- Restart and stop operations can be performed
inspectoutput can be retrieved
This feature saves a lot of time, especially on systems running multiple containers. Instead of typing docker ps, docker logs, docker inspect, and docker restart one by one, a more organized workflow is created.
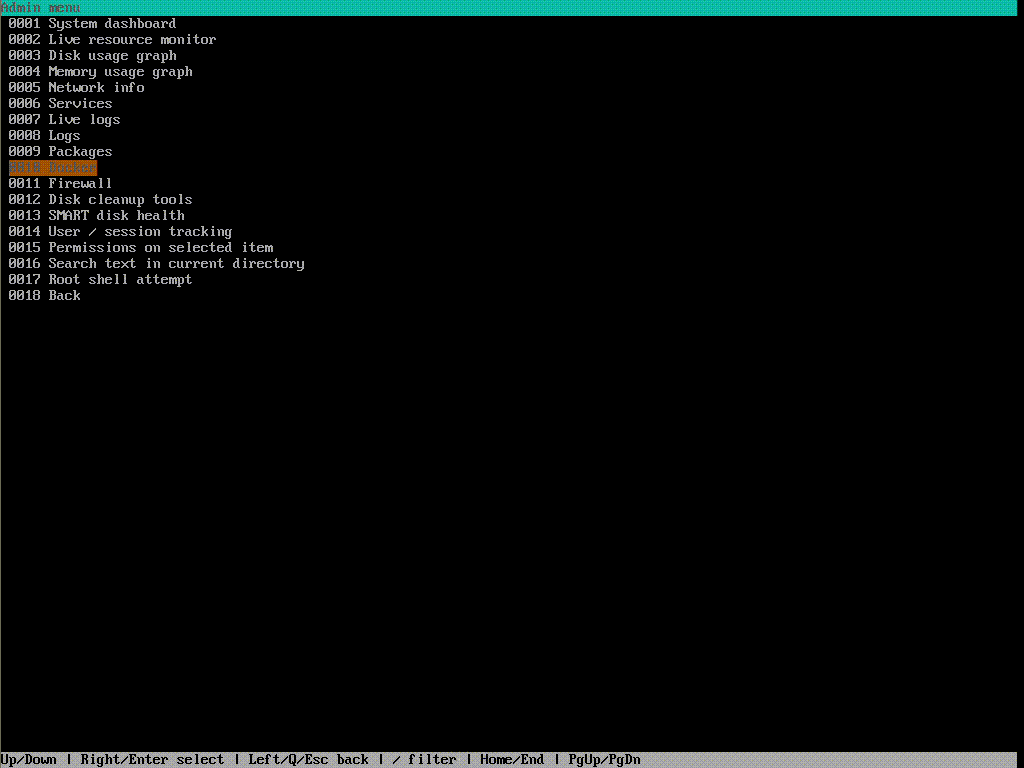
Firewall, Disk Cleanup, and SMART Monitoring
The tool is not limited to basic file and service management. Additional modules focused on system maintenance have also been added.
Firewall Management
If the system has ufw or firewalld, the menu adjusts accordingly. From here, status display, enable/disable, and reload operations can be performed. This is especially useful in quick control and maintenance scenarios.
Disk Cleanup Tools
Since disk usage is one of the most common problems on servers, I added small maintenance utilities:
- Find large files
- List old logs under
/var/log - Preview the contents of
/tmp - Clean old files inside
/tmp
SMART Disk Health
If smartctl is installed, physical disk health can also be viewed. This is particularly important for detecting hardware issues early.
User and Session Tracking
For server security and activity tracking, user session information is also important. That is why the tool includes sections such as:
wholast- Failed login summaries
This makes it possible to quickly check active users, past logins, and failed attempts.
Security and Controlled Operation Logic
One of the things I paid attention to in this project was preventing users from performing dangerous operations instantly and unintentionally.
For example:
- Permanent delete requires double confirmation
- Warnings are shown for operations that may require root
- The delete menu first follows a move-to-trash logic
- Root shell attempts are not started directly but only after confirmation
- If the destination already exists, a new name is requested
- Source and destination details are shown before an operation
These may look like small details, but they are very important for reducing the margin of error in server administration.
A Structure Accessible from Anywhere via GitHub
One important aspect of this project for me was that it did not remain only as a local tool. I had previously built a GUI-based server manager project that could be installed on Windows. But the most important difference that separates this terminal-based version from that one is that it turned out to be much more flexible and portable.
Because in practice, I am not always on my main machine. Sometimes I am on rack PCs, sometimes right next to the server, and sometimes accessing servers from a completely different computer. In those situations, having to rebuild the same working setup on every device wastes time. What I wanted was to be able to access the project quickly on any computer and continue where I left off.
That is why I uploaded the project to GitHub. This way, whenever I need it, I can pull the code with a single command and install it. This approach has been very useful for my own workflow and has also made installation much easier for anyone who wants to try the project.
Those who want to download the project and start using it can install it directly with the following command:
git clone https://github.com/ali-durmus/server-manager.git && cd server-manager && sudo ./install.sh
Thanks to this structure, even if the computer I am using changes, I do not have to search for the tool again, move files around, or deal with manual installation steps. I can pull the project from GitHub and have it working again within a few seconds. Especially for someone who frequently changes systems, manages servers from different machines, or works in the field, this provides serious flexibility.
At the same time, this allowed the project to evolve from being just a personal-use tool into something others can easily download and try. So the goal here was not just to build a tool, but also to create a practical, sustainable working utility that is quickly accessible in any environment.
What Was the Biggest Advantage This Tool Gave Me?
While writing this project, my core motivation was not to produce something that is merely “possible,” but to produce something that can be done “quickly and in an organized way.”
Today, when I look back, I can say that it helped me most in the following areas:
- First, it accelerated my workflow.
- Second, it gathered frequently used operations into a single center.
- Third, it reduced the cost of mental context switching.
- Fourth, it reduced repetitive command labor.
- Fifth, it made daily server maintenance more fluid.
So this tool is not just a “TUI file manager”; it is also an accelerated version of daily system administration operations.
Features I Plan to Add in the Future
Even in its current state, this project is already very useful in daily work. But there is still a lot of room for development. The code structure is suitable for being extended further. The main features I plan to add in the coming period are:
1. Multi-selection support
I want to add the ability to select multiple files or folders at once and perform bulk move, copy, archive, or permission changes.
2. Advanced service management
Right now, restart and stop are available. In addition, start, enable, disable, daemon-reload, and dependency display operations could be added.
3. Advanced log filtering
Filtering by date range, narrowing by keyword, selecting log levels, and regex-based search would all be useful additions.
4. File comparison tool
A diff screen that shows the differences between two selected config files side by side would be highly functional.
5. SSH connection profiles
I am considering adding saved connection profiles for different servers, a favorite hosts list, and a quick-switch screen.
6. Cron and scheduled task management
Support for viewing, editing, and creating new crontab entries would add an important layer to the tool.
7. Nginx / Apache helper panel
Special helper panels could be added for virtual host files, active domains, config tests, and service reload workflows.
8. Database helper tools
Basic control, service status, connection testing, and quick backup sections for MySQL, MariaDB, or PostgreSQL could be added.
9. Backup and snapshot module
I plan to add workflows for archiving specific directories with timestamps, backing them up to remote targets, and restoring them.
10. Fail2Ban and security monitoring
A security screen showing ban lists, jail status, IP-based blocks, and recent attack attempts would be useful.
11. Disk usage heatmap
A space analysis panel that visually shows which directories consume the most storage could be added.
12. Theme and personalization support
Different color themes, shortcut customization, and appearance settings based on user preferences could be introduced.
13. Plugin architecture
At a more advanced stage, it could be great to evolve the project into a plugin-based architecture where anyone can add their own modules.
14. Web panel integration
The terminal side is fast and lightweight, but some users may also want a visual panel for remote access. So in the future, it may be possible to match some features of this tool with a web-based interface as well.
Conclusion: Tools Born from Real Needs Are the Most Useful Ones
While developing this project, I was driven less by the desire to create an academic product and more by the motivation to directly speed up my own work. I think the most useful tools emerge exactly this way: from a real need.
Command knowledge is still extremely valuable in server management. I have no objection to that. But at the end of the day, what matters is not only being able to do a task, but being able to do it faster, more safely, more neatly, and with less effort.
For me, this tool achieved exactly that.
Especially in the maintenance, inspection, and intervention processes that begin after server setup, building a structure that reduces the burden of repeated commands, offers both file management and live system monitoring on the same screen, and gathers many tasks — from services to logs — in one center has truly saved a serious amount of time.
This project is still open to improvement. I plan to add new modules as new needs arise. But even in its current form, it has already turned into a very useful, lightweight, and practical assistant for daily server operations.
If you also work heavily with servers, sometimes the best solution is not to install a ready-made panel, but to build the tool yourself — one that truly fits your workflow and meets your real needs.
And sometimes the only difference is this:
It may be possible to do the same job with commands, but doing it with an organized tool built on a one-click logic is much faster.