Sharing notes from my ongoing learning journey — what I build, break and understand along the way.
AssetObserve: IT Asset Inventory and Risk Visibility Dashboard

AssetObserve: Making IT Assets More Visible
AssetObserve is an IT inventory and risk observation project I have been working on for a while. The starting point is actually quite simple: Which devices exist in a network, what condition are they in, where are risks forming, and how can I show all of this clearly to someone who is not technical?
As a Fachinformatiker Systemintegration student, while developing the project, I try to focus especially on needs that can appear in real-life environments. Because on the systems side, the question “is there a device?” is not enough. It is also important to know what that device does, how long it has been visible, which services it provides, which risks it is related to, and whether all of this can be reported.
That is why I am designing AssetObserve not only as a scanning tool, but more like a visibility panel for small and medium-sized IT environments.
First Goal: Organizing the Inventory
One of the most basic problems in an IT environment is that the inventory is scattered. Some devices are tracked in Excel, some are remembered, and some are only noticed when they cause a problem. My first goal with AssetObserve was to bring this visibility into one central screen.
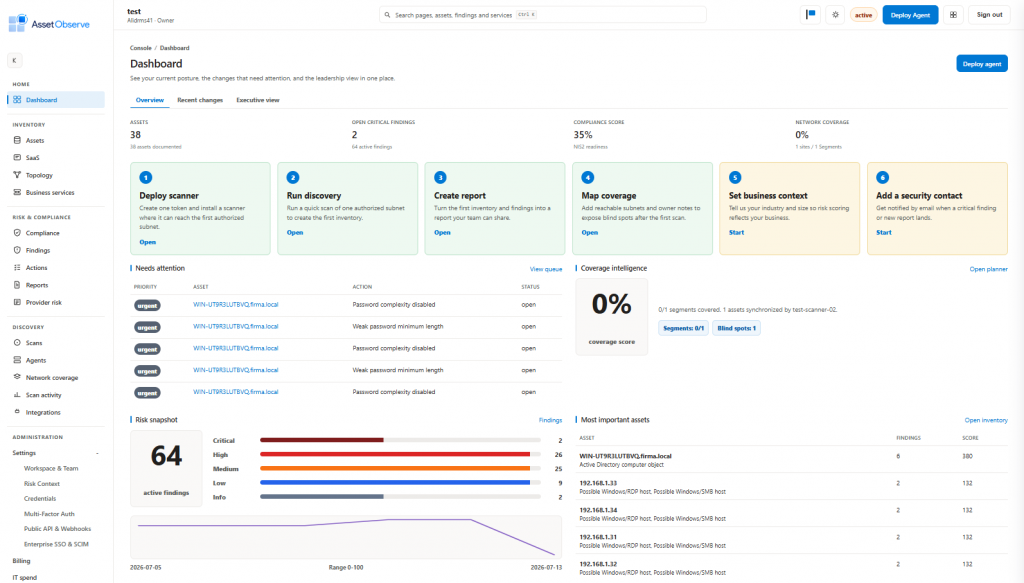
On the dashboard, the total number of assets, open findings, coverage status, and recent changes can be seen at a glance. The goal here is to answer the question “what is the general state of the environment right now?” quickly, without overwhelming the user with technical details.
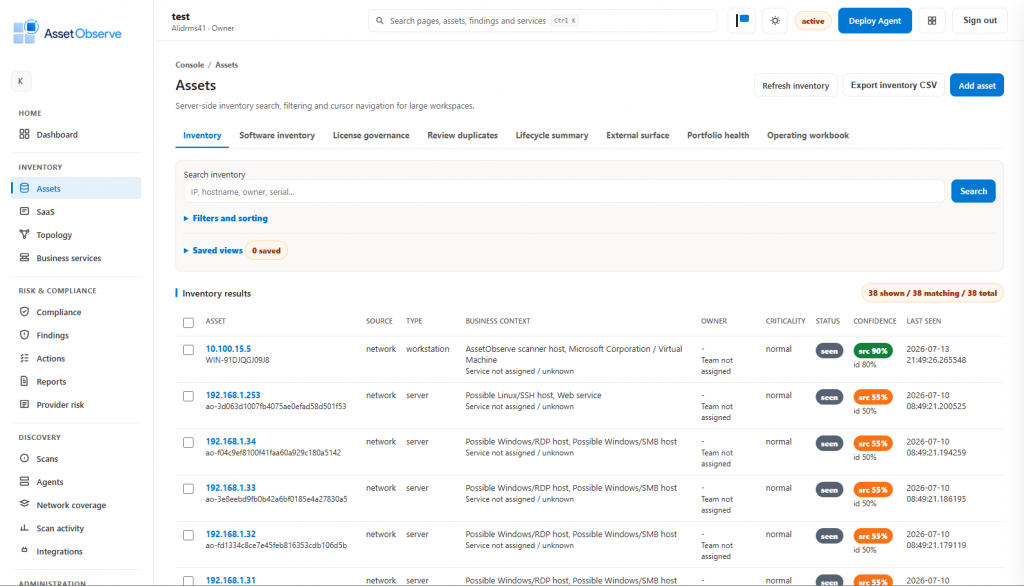
In the asset list, devices are not shown only as IP addresses. Whenever possible, they are displayed together with information such as hostname, role, source, status, criticality level, and last seen time. This makes it possible to see not only that a device “exists”, but also how it should be handled from an IT perspective.
Looking Closely at a Single Device
The general inventory is important, but sometimes it is necessary to go into the details of a single device. In AssetObserve, the asset detail screen keeps basic information, observed services, related findings, historical information, and business context together for that asset.
I designed this part especially from a system administrator’s point of view. When I open a device, I want to be able to answer questions like “what is this, when was it seen, which services does it have, and is there anything risky?” on a single screen.
Coverage Area: What Do I See, What Do I Not See?
In my opinion, another topic as important as inventory is coverage. Because a dashboard may look good, but if we do not know which network segments it actually covers, it can create a false sense of security.
That is why AssetObserve has a Coverage Planner section. Here, it is possible to see which areas are monitored and which areas remain uncovered through site, subnet, segment, and agent mappings.
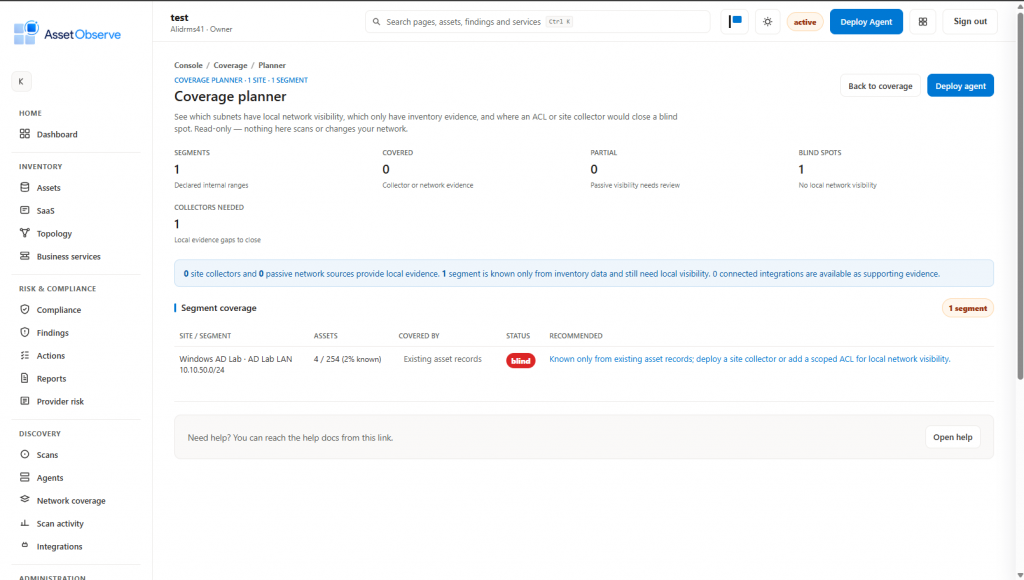
In this section, I especially care about the “blind spot” concept. In other words, the system should not only show what it sees, but also remind you of the areas that are not yet covered. In real life, most problems already start in the places that are not visible.
Agent Logic
In the model I use while developing AssetObserve, there is a dashboard and, alongside it, the idea of an agent running inside the customer network. The goal here is not to install a separate agent on every device. It is more about observing the environment through a scanning point positioned inside an authorized network.
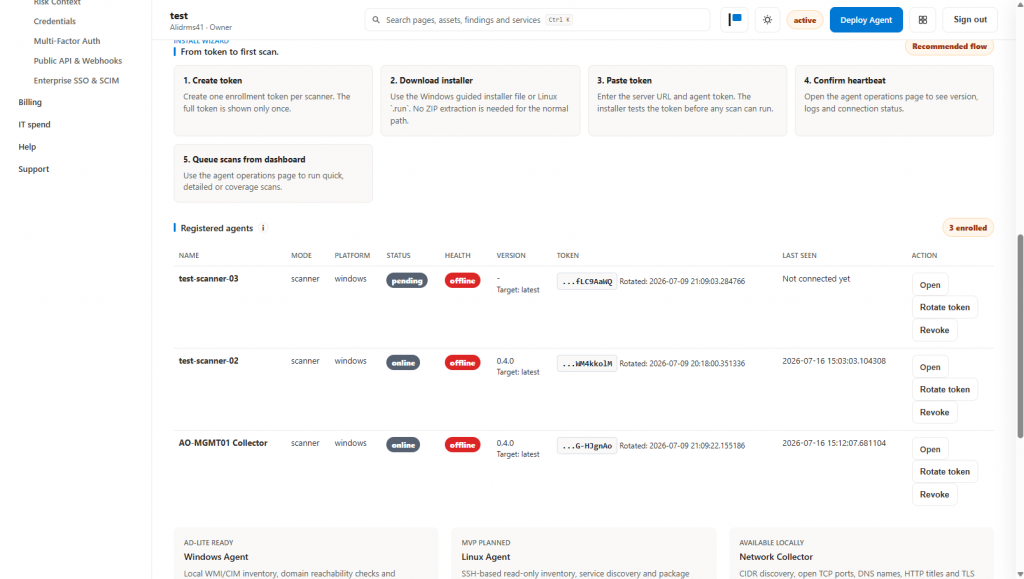
I do not want to explain this part too technically in the blog, because the focus of the project is less “how does it work?” and more “what is it useful for?”. In short: the agent is the component that helps collect inventory and status information in authorized networks. The dashboard is the place that turns this information into something meaningful.
In the development and test environment, the project can run on Docker. For me, this keeps the environment more organized and makes it easier to run again on different machines. I intentionally do not share production or security-related details; in projects like this, it is better not to provide unnecessary technical details.
Starting a Scan
When starting a new scan in AssetObserve, the user first selects what will be scanned: the interface is prepared for different options such as network discovery, credentialed inventory, cloud providers, or directory services.
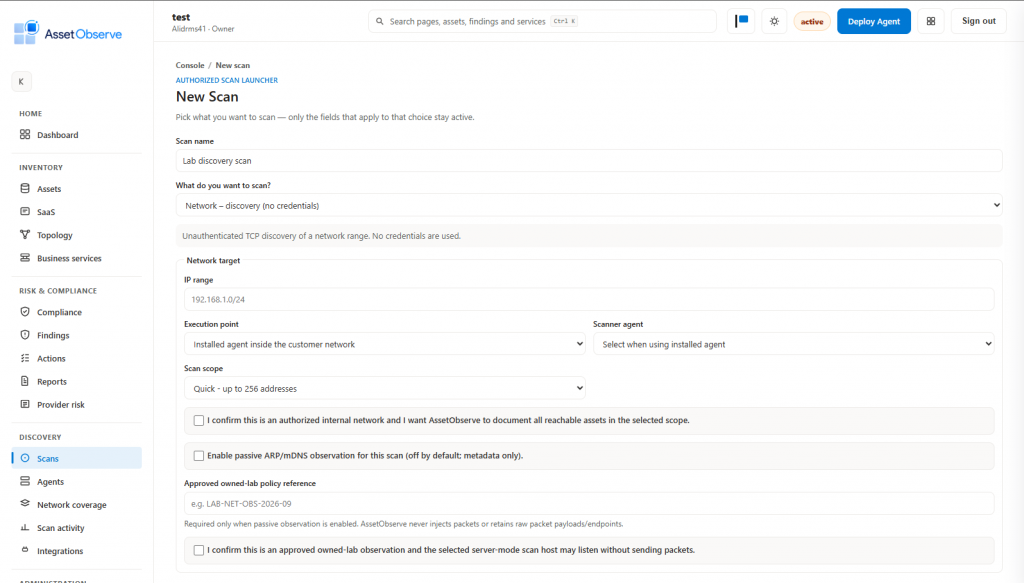
Here, I especially want to emphasize the “authorized scan” approach. AssetObserve is not designed to be used on networks without permission. The goal is not to exploit vulnerabilities or interfere with systems; the goal is to read and document the existing environment.
After the Scan: Findings and Changes
After a scan is completed, discovered devices, open services, risk findings, and changes compared to the previous state can be seen. This is one of the most useful parts of the project for me: it is not only a live list, but a picture of an infrastructure that changes over time.
For example, if a device that was not visible before appears, or if a new port becomes visible on a device, this change becomes trackable. This makes it easier to answer the question “something changed in the network, but what changed?”
Listing Risks Is Not Enough, They Need to Be Understandable
This is why findings are collected on a separate page in AssetObserve. If a finding remains only a technical row, it often does not turn into action. That is why severity, related asset, description, recommendation, and business context are shown in the same table.
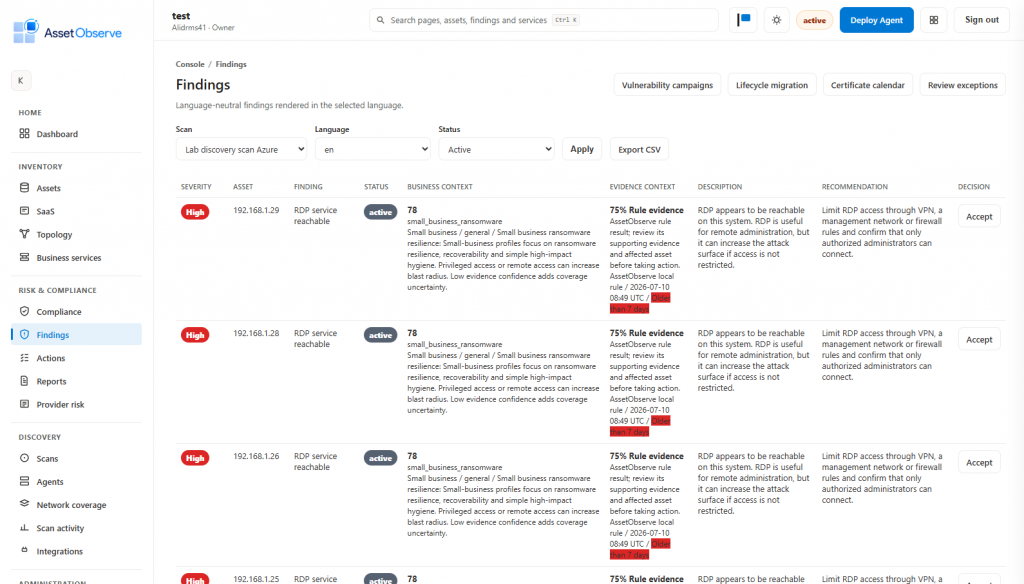
My goal here is to help the technical team prioritize quickly. If everything is shown as “critical”, then nothing is truly critical. That is why it is important to classify risks and show which issue should be handled first.
Action Tracking
Seeing a finding is half of the work. The other half is deciding who it will be assigned to, when it will be handled, and what its status is. The Actions section in AssetObserve exists for this purpose.
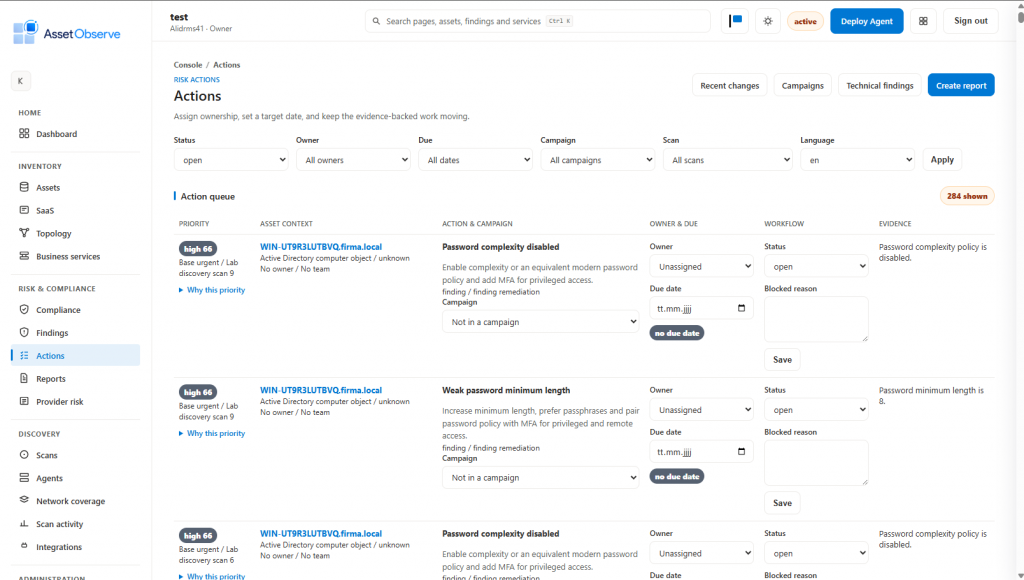
This section works like a small task-tracking logic. But I am not trying to build a classic ticket system. I see it more as an area that keeps risk-related work visible and answers the IT team’s question: “what should we look at today?”
Topology: Not Only Listing Devices, but Seeing Their Relationships
The inventory screen is useful for tracking devices in table form, but understanding infrastructure is sometimes not limited to a list. That is why I am also developing a topology view inside AssetObserve.
The goal of the topology section is to prevent devices and network segments from remaining as disconnected pieces of information. I want to provide a more visual answer to questions such as what exists in which segment, which assets appear in the same environment, and how services and infrastructure components form a whole.
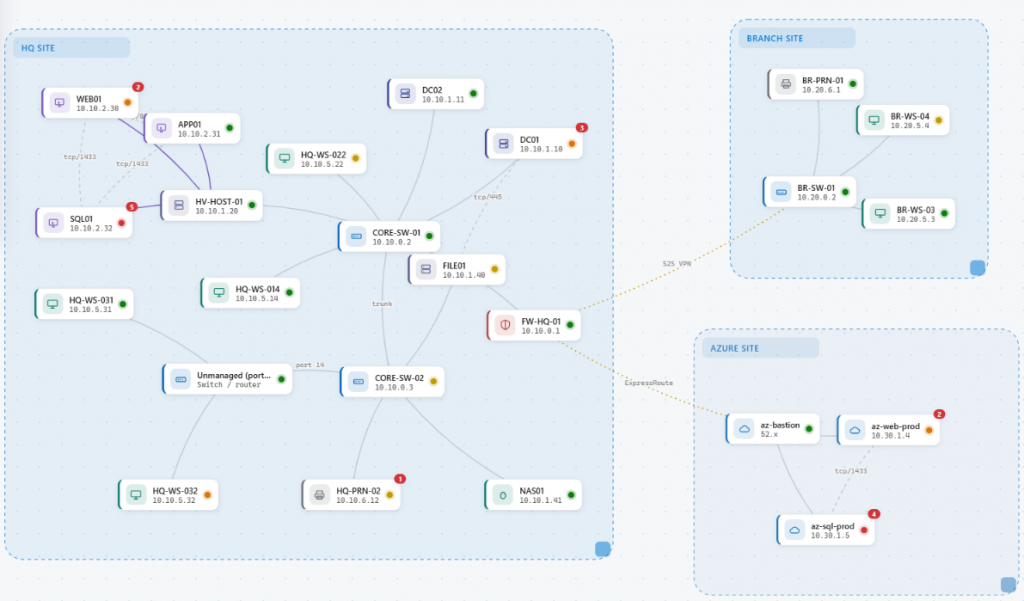
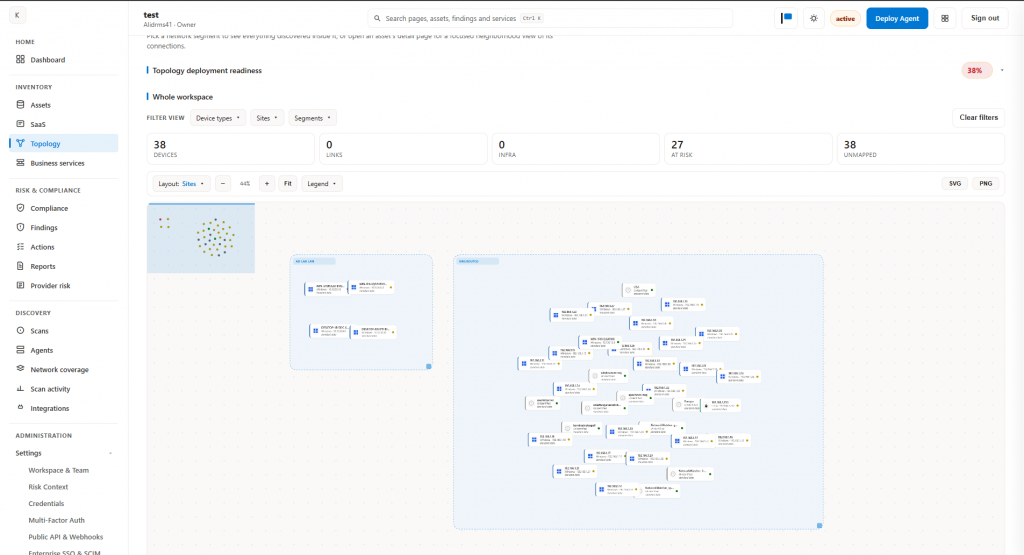
This section is especially important from a system integration perspective. Because in real environments, the problem may not be limited to a single device; sometimes a network segment, a service dependency, or a wrongly positioned system can affect the whole picture. The topology screen exists to make this bigger picture easier to understand.
Integrations: The Idea of Collecting Data in One Place
Another area I consider important alongside reporting is the integrations section. One of AssetObserve’s long-term goals is not only to show the data it collects itself, but also to become a central point that can communicate with different security, ITSM, SIEM, firewall, or collaboration tools.
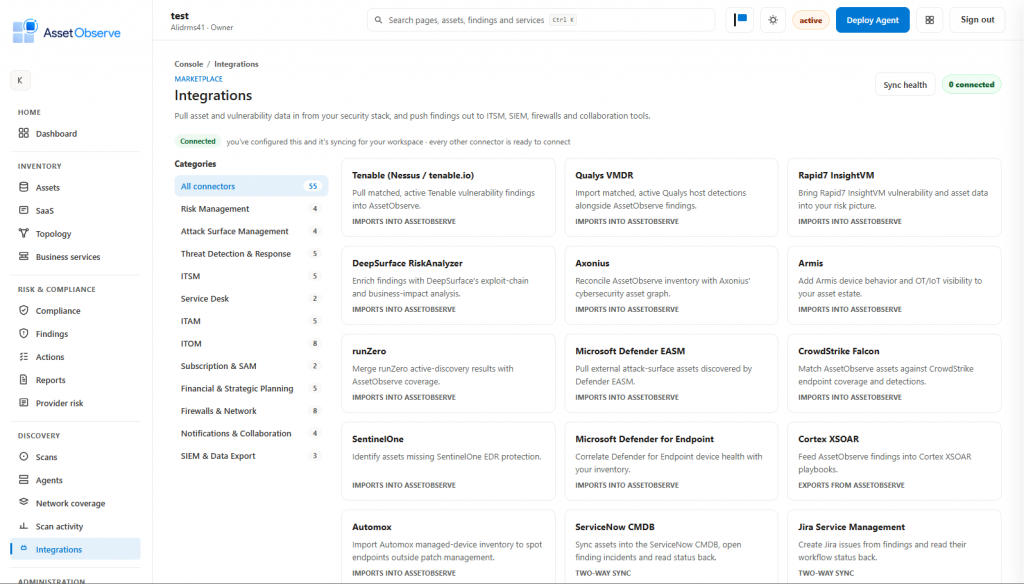
I am designing this part with a marketplace logic. Some integrations can be used to bring data in, while others can be used to send findings or actions to external systems. For example, scenarios such as pulling data from security tools, sending actions to the ITSM side, or tracking connection status from the sync health screen are collected here.
Reporting
Finally, there is the reporting section. Because a technical dashboard may be useful for the IT team, but management or audit teams need a simpler and more organized output. In AssetObserve, I am working on management reports, technical reports, action plans, and export options.
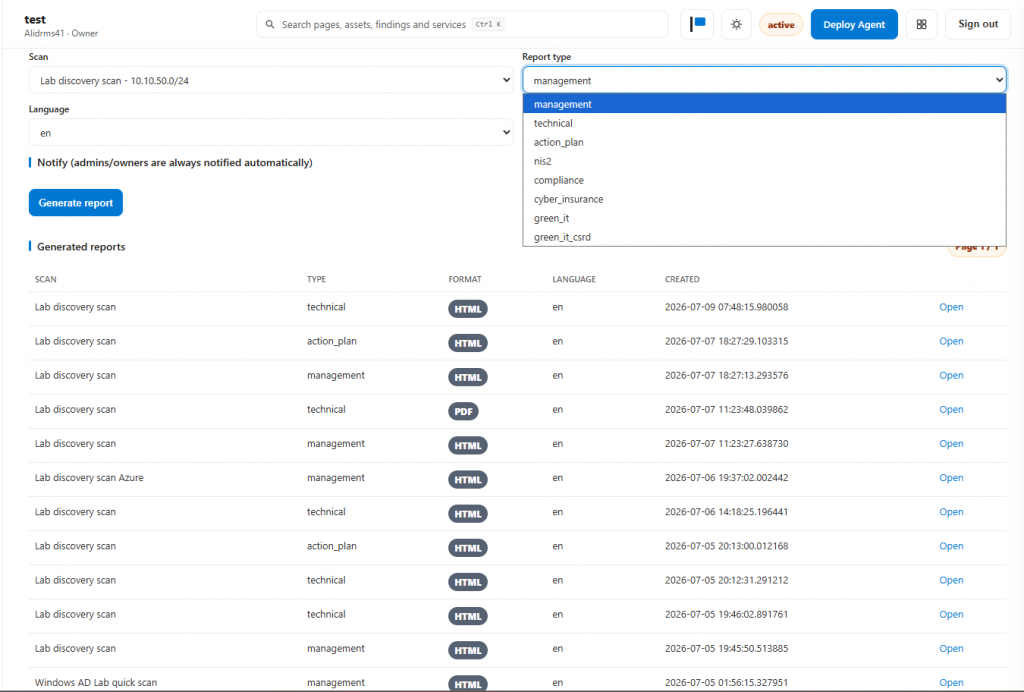
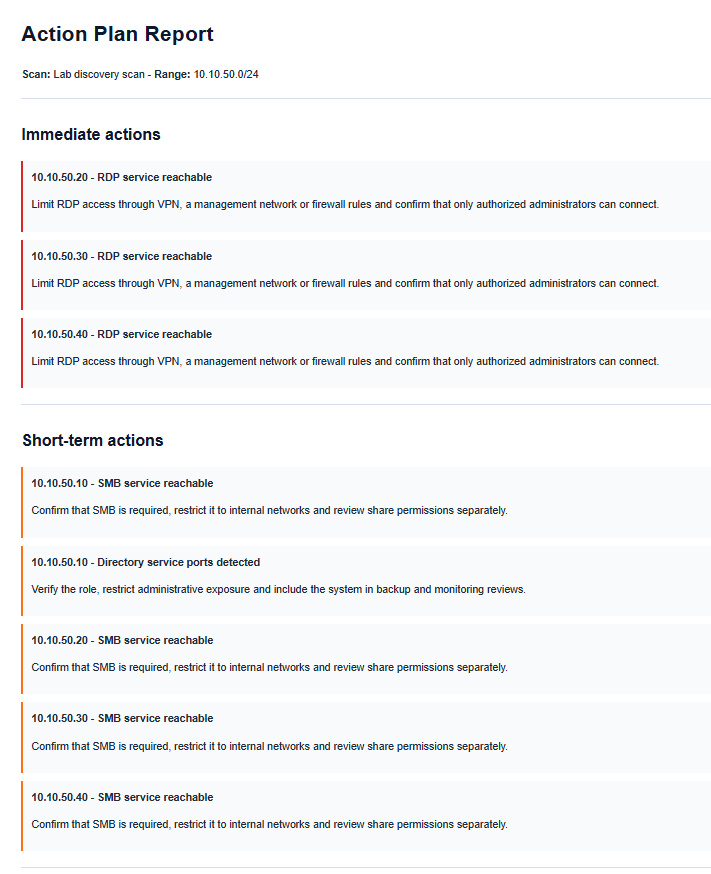
My goal on the reporting side is to make information such as “there are this many devices, these risks were found, and these actions are recommended” readable. Especially because topics like NIS2 are becoming increasingly important for small and medium-sized businesses, I think turning technical data into an understandable report is valuable.
Compliance: Seeing the Preparation Status
One of the important sections I developed in AssetObserve is the Compliance screen. The goal here is not to give an organization a definitive result like “you are fully compliant”; instead, it is to make the preparation status more visible through existing technical data and manual answers.
On the Compliance screen, there are evaluation cards for different security frameworks alongside frameworks such as NIS2. The system can automatically interpret some controls using technical evidence from the latest scan. For the remaining parts, the user can mark their own organizational answers.
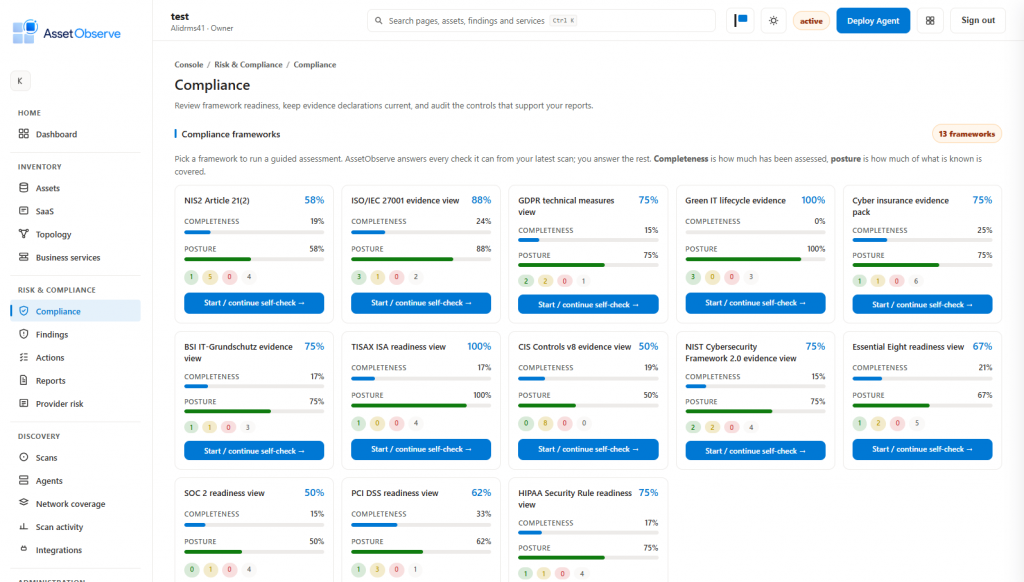
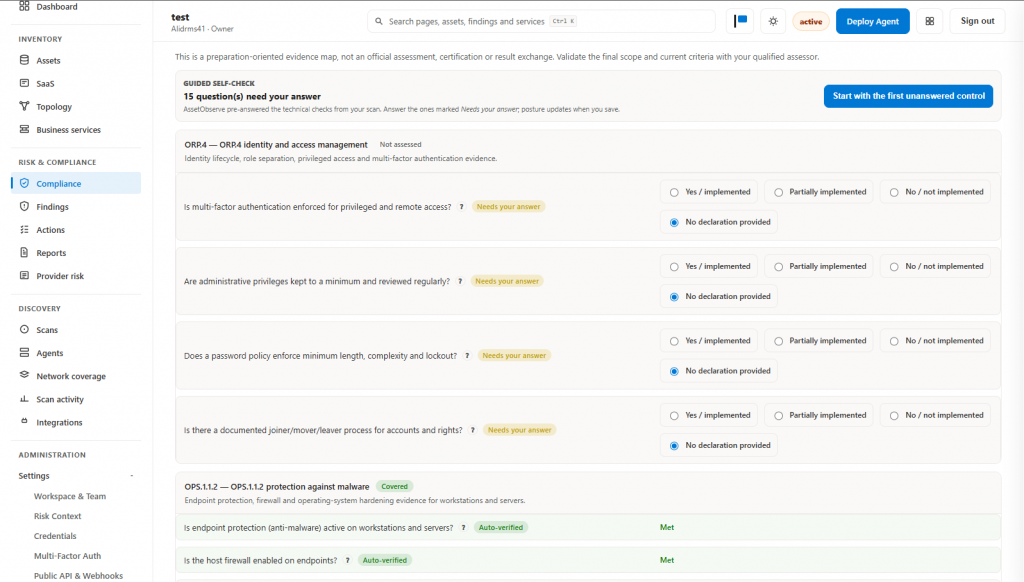
On this screen, I especially try to separate two concepts: completeness and posture. Completeness shows how much of the assessment has been filled in. Posture describes how good the situation looks based on the available information. This distinction is important, because giving a high security score with missing information can be misleading.
Current Status
For me, AssetObserve is both a learning project and a way to shape a real product idea. It includes many parts such as inventory, dashboard, agent management, coverage planning, risk findings, action tracking, and reporting.
I do not yet see it as a finished commercial product. I see it more as a project where I apply what I learn in the field of system integration to a real problem and grow it step by step. The part I like most is this: the project is not only about writing code. It requires thinking about network structure, secure operating boundaries, user experience, reporting, and what the business side wants to see at the same time.
With AssetObserve, my goal is to make IT infrastructure more understandable, more trackable, and more reportable. In short: what exists in the network, what changed, where is the risk, and what is the next logical step? I am trying to develop a tool that can answer these questions from one place.