Sharing notes from my ongoing learning journey — what I build, break and understand along the way.
Build a Python SCADA Dashboard with KEPServerEX & OPC UA
How to Build a Real-Time Industrial SCADA System using Python and KEPServerEX
In the era of Industry 4.0 and Digital Transformation, the biggest challenge for factories is making machines that speak dozens of different languages on the shop floor (Siemens S7, Modbus, MQTT, etc.) communicate with modern IT systems (Python, Cloud, Data Analytics) on the top floor. While Operational Technology (OT) is legacy, robust, and closed-loop, Information Technology (IT) is modern, flexible, and open-source.
In this article, we will examine step-by-step how we built a fully-fledged Digital Twin and SCADA (Supervisory Control and Data Acquisition) architecture that bridges these two worlds from scratch. Best of all, we achieved this by completely simulating the hardware layer, without needing a physical PLC!
1. Project Architecture and Tools Used
If we think of this project as a building, the machines generating the data are the foundation, the bridge translating the data is the middle floor, and the interface visualizing the data is the roof. The exact roles of the software we used in our project are as follows:
- KEPServerEX 7 (The Universal Translator): An industry-standard OPC server. It understands the languages of the PLCs on the shop floor and translates them into a single universal standard (OPC UA) to serve IT systems.
- OPC UA (Communication Protocol): The “USB cable” of the industry. It is a platform-independent, secure, and encrypted data communication bridge.
- UAExpert (The Engineer’s Stethoscope): A diagnostic tool we use to connect to OPC UA servers and test whether data is flowing healthily, as well as to verify certificates and node addresses.
- Python & Streamlit (Modern SCADA): The coding environment where we process the raw incoming data, analyze it, and transform it into a web-based, live monitoring screen (Dashboard) for operators.
2. Core Setup: Creating the Data Layer with KEPServerEX
We begin by configuring Kepware, which will be the central hub where our data is collected. In a real-world scenario, “Siemens TCP/IP” or “Modbus” devices would be added here. For this project, we designed a virtual machine line using the “Simulator” driver.
- We created a communication channel named
Line_01. - Under this, we defined a virtual device named
Filling_Machine. - To monitor the real-time status of the machine, we created three different tags:
Temperature,Tank_Level, andProduction_Count.
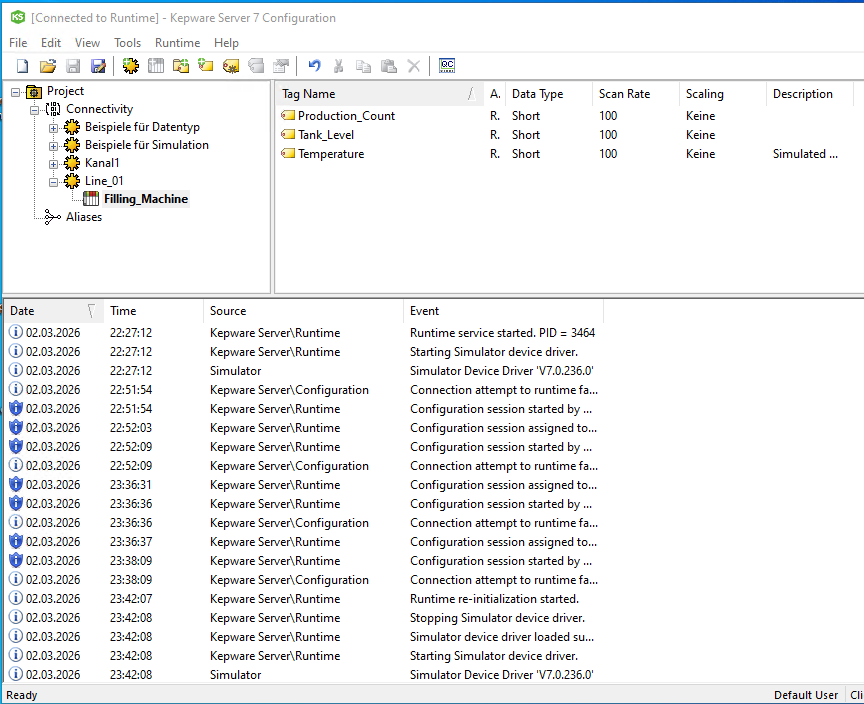
Thanks to these tags, the Python code we write on the IT side will be able to read data by directly targeting these specific addresses.
3. The Toughest Wall in the Industry: IT/OT Security Settings (OPC UA Endpoint & Anonymous Login)
In OPC UA projects, developers waste the most time not on writing code, but on configuring security certificates and authentication. As expected, when our Python client first tried to connect to Kepware, we encountered the “BadSecurityChecksFailed” error. This is because industrial servers are closed to all external connections by default.
To open this door consciously and securely, we followed these steps:
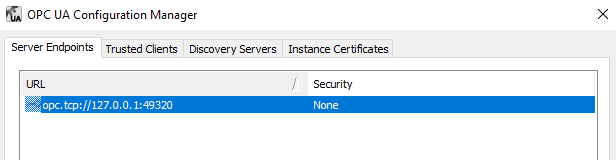
A. Relaxing Security Policies: By navigating to Kepware’s OPC UA Configuration menu, we removed encryption from the security policies in the Server Endpoints section, leaving only the “None” option active. In development environments, this allows external clients like Python to get in without getting tangled in certificate complexities.
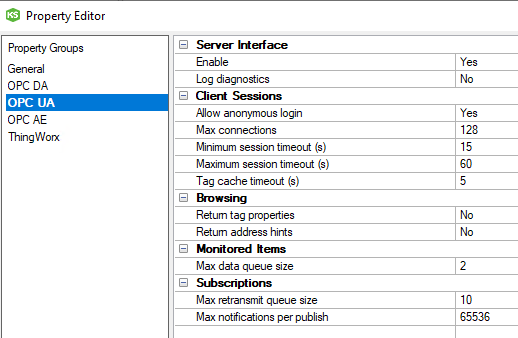
B. Allowing Anonymous Clients: Even if we lower the firewall, Kepware still expects a “Username/Password” from the incoming connection. For our Python code to enter without credentials, we navigated to Project Properties -> OPC UA tab and set the “Allow anonymous login” option to “Yes”.
After applying these two critical settings, we successfully and securely opened the doors of our OT system to our IT system.
4. Testing Phase: Validation with UAExpert Before Hitting the Shop Floor
As IT developers, before we start writing code for a system, we must be absolutely certain that the data actually exists. This is where UAExpert comes into play.
We opened the UAExpert program and connected to Kepware’s local IP address (opc.tcp://127.0.0.1:49320). We located our machine in the address space tree and dragged the tags we created into the “Data Access View” screen. The result: The data was ticking away flawlessly! This step proved to us that any potential errors during the coding phase would originate from our code, not from Kepware.
5. Building the Bridge: Python OPC UA Client and Version Management
Now it was time to pull this data from Kepware and integrate it into our own application. We established an asynchronous communication loop using Python’s asyncua library.
A Technical Challenge Encountered: Version Hell When starting the project, we used the latest version of Python (3.14). However, during asynchronous data reading in the background, we constantly hit an issubclass() arg 1 must be a class type-checking error. This is one of the most common occurrences in OT/IT projects: Industrial protocol libraries often cannot immediately adapt to the newest (bleeding-edge) language versions.
As a solution, we reverted to the stable industry standard (LTS), namely Python 3.12. To make our code even more robust, we fetched the raw data from Kepware using the .read_data_value() function and manually cast them to Float/Integer types within Python.
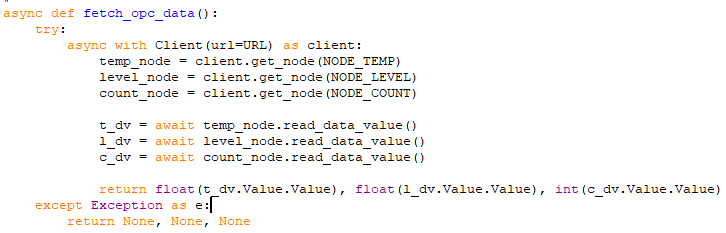
Thanks to the code block above, even if the Kepware connection drops momentarily, our system can manage the state without crashing.
6. Visualizing the Data: Live SCADA Dashboard with Streamlit
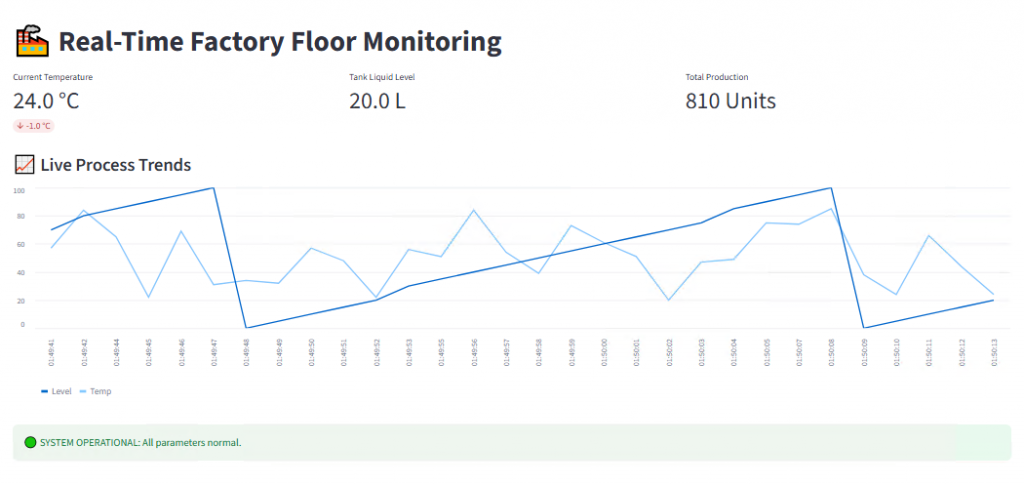
Seeing the data we receive on the Python side merely on a black terminal screen means nothing to an operator. To develop a fast and modern web interface, we utilized the Streamlit library. Streamlit allowed us to create interactive dashboards directly through Python scripts without writing a single line of HTML or CSS.
When we fired up our Python code with the python -m streamlit run factory_scada.py command, we were greeted with an industrial-standard monitoring panel. The panel featured real-time temperature, tank level, and trend charts updated every second.
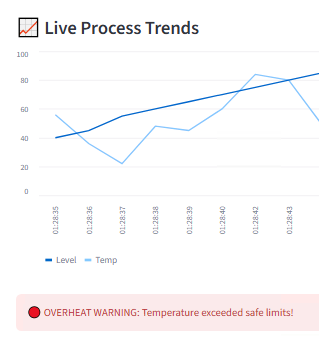
Alarm Logic and the Power of Automation
A SCADA system doesn’t just monitor; it also makes decisions and issues warnings. We added a simple decision-support algorithm to our code: If the temperature exceeded 50 °C, the system state needed to change, and an urgent notification had to be sent to the operator. The moment the temperature in our simulation data crossed the threshold, our interface reacted instantly, triggering the OVERHEAT WARNING alarm.
7. Conclusion: The Successful Synergy of IT and OT
In this project, we successfully established communication between KEPServerEX, which represents the sensors on the shop floor, and the Python/web interface, which represents the top-floor management systems. We bypassed firewalls, experienced and resolved version mismatches, and created a live Digital Twin interface from scratch.
What’s Next? (A Teaser for Part 2) Seeing data is great, but saving and analyzing it is what creates real business value. In the next phase, we will log the data flowing from this interface second by second into a time-series database (in CSV format) and use Power BI to create a professional, historical “Production Efficiency Report.”
See you on the next leg of the digital transformation journey for factories!